
Page 100 - GFS2019 Semster I
P. 100
1
0.0
0.0
0.0
0.0
0.0
General Government b/ (9) Cash 9,004,581,967,124.8 1,014,395,469,177.3 339,196,945,746.0 7,650,989,552,201.5 5,910,746,788,383.5 3,060,251,495,424.4 1,607,943,542,908.1 1,127,247,659,777.0 8,613,130,000.0 106,690,960,274.0 3,093,835,178,741.3 339,977,616,396.0 324,239,720,396.0 15,737,896,000.0 339,977,616,396.0 2,753,857,562,345.3 6,700,000,000.0 6,700,000,000.0 -6,996,743,763.0 -6,996,743,763.0 -13,696,743,763.0 2,740,160,818,582
... 0.0 ... ... ... ... ... ... ... 0.0 0.0
Consolidation Column (8) Cash -4,966,458,009,837.0 -4,966,458,009,837.0 -4,966,458,009,837.0 -4,966,458,009,837.0
... ... ... ... ... ... 0.0 ... 0.0 ... ... ... ... ... ... ... ... ... ... ... ... ... ... ... ... ... ... ... 0.0 ... ... 0.0
Local Governments (7) Cash 4,450,227,646,280.1 83,748,794,189.3 4,140,671,513,659.0 225,807,338,431.8 2,957,680,346,606.6 1,700,317,158,145.4 703,313,215,763.1 535,158,737,171.0 3,300,730,000.0 15,590,505,527.0 1,492,547,299,673.5 122,844,636,785.8 109,414,740,785.8 13,429,896,000.0 122,844,636,785.8 1,369,702,662,887.7 6,700,000,000.0 -6,996,743,763.0 -6,996,743,763.0 -13,696,743,763.0 1,356,005,919,124.7
... 0.0 0.0 0.0 ... ... 0.0 ... ... ... ... ... 0.0 0.0 ... 0.0 0.0 0.0 0.0 0.0
State Governments (6) Cash 1,530,126,158,721.7 277,376,909,733.0 1,164,983,441,924.0 87,765,807,064.7 920,747,126,974.9 531,506,015,765.0 188,989,386,787.9 175,186,323,922.0 25,065,400,500.0 609,379,031,746.8 60,863,378,666.2 60,863,378,666.2 60,863,378,666.2 548,515,653,080.7 548,515,653,080.7 7/29/2019 2:51 PM
0 ... 0.0 0.0 0.0 ... ... ... ... ... ... ... 0.0 0.0 ... 0.0 0.0 0.0 0.0 0.0 0.0
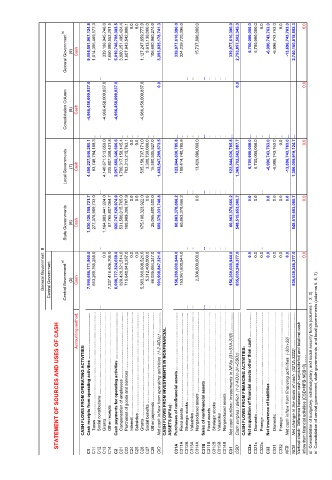
General Government Central Government Central Government a/ (5) Cash 7,990,686,171,960.0 653,269,765,255.0 7,337,416,406,705.0 6,998,777,324,639.0 828,428,321,514.0 715,640,940,357.0 5,383,360,608,521.0 5,312,400,000.0 66,035,054,247.0 991,908,847,321.0 156,269,600,944.0 153,961,600,944.0 2,308,000,000.0 156,269,600,944.0 835,639,246,377.0 Net acquisition of financial assets other than cash ......................................................
... Cash payments for operating activities .................................................................................................................................................... Purchases of goods and services .................................................................................................................................................... ... ... ... ... ... ... ... Cash surplus / deficit (1-2-ADJz-31
Accounting method: Cash receipts from operating activities ................................................................................................... Taxes .................................................................................................................................................... Social contributions .......................................................................................................................
STATEMENT OF SOURCES AND USES OF CASH
CASH FLOWS FROM OPERATING ACTIVITIES: CASH FLOWS FROM INVESTMENTS IN NONFINANCIAL ASSETS (NFAs): CASH FLOWS FROM FINANCING ACTIVITIES: Net incurrence of liabilities Vertical check: Difference between cash surplus/deficit and total net cash inflow from financial activities (CSD+NFB-NCB=0) ....... a/ Consolidation of budgetary, extrabudgetary, and social security funds (columns 1, 2, 3). b/ Consolidation of central government, state government
C1 C11 C12 C13 C14 C2 C21 C22 C24 C25 C26 C27 C28 CIO C31A C311A C312A C313A C314A C31B C311B C312B C313B C314B C31 CSD C32x C321x C322x C33 C331 C332 NFB NCB