
Page 98 - GFS2019 Semster I
P. 98
1
0.0
0.0
0.0
0.0
0.0
0.0
0.0
0.0
0.0
0.0
0.0
0.0
0.0
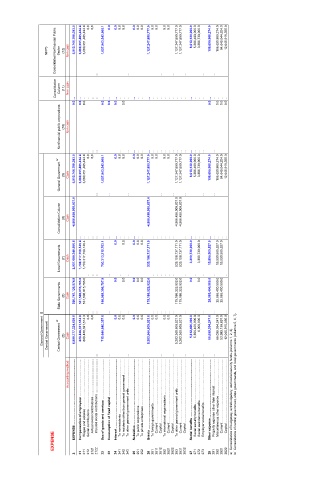
NFPS Consolidated Nonfinancial Public Sector (12) Non cash 5,910,746,788,383.5 3,060,251,495,424.4 3,060,251,495,424.4 1,607,943,542,908.1 1,127,247,659,777.0 1,127,247,659,777.0 1,127,247,659,777.0 8,613,130,000.0 5,306,400,000.0 3,306,730,000.0 106,690,960,274.0 106,690,960,274.0 94,645,044,924.0 12,045,915,350.0
... ... ... ... ... ... ...
Consolidation Column (11) Non cash
... ... ... ... ... ... ... ... ... ... ... ... ... ... ... ... ... ... ... ... ... ... ... ... ... ... ... ... ... ... ... ... ... ...
0.0 0.0 0.0 0.0 0.0 0.0 0.0 0.0 0.0 0.0 0.0
Nonfinancial public corporations (10) Non cash
... ... ... ... ... ... ... ... ... ... ... ... ... ... ... ... ... ... ... ... ... ... ...
b/ 0.0 0.0 0.0 0.0 0.0 0.0 0.0 0.0 0.0 0.0 0.0 0.0 8,613,130,000.0 5,306,400,000.0 3,306,730,000.0 106,690,960,274.0 106,690,960,274.0 94,645,044,924.0 12,045,915,350.0
General Government (9) Cash 5,910,746,788,383.5 3,060,251,495,424.4 3,060,251,495,424.4 1,607,943,542,908.1 1,127,247,659,777.0 1,127,247,659,777.0 1,127,247,659,777.0
... ... ... ... ... ... ... ...
Consolidation Column (8) Cash -4,966,458,009,837.0 -4,966,458,009,837.0 -4,966,458,009,837.0 -4,966,458,009,837.0
... ... ... ... ... ... ... ... 0.0 ... ... 0.0 ... ... 0.0 ... 0.0 ... 0.0 ... ... ... ... ... ... ... ... ... ... ... ... ... ... ... ... 7/29/2019 2:53 PM
Local Governments (7) Cash 2,957,680,346,606.6 1,700,317,158,145.4 1,700,317,158,145.4 703,313,215,763.1 535,158,737,171.0 535,158,737,171.0 3,300,730,000.0 3,300,730,000.0 15,590,505,527.0 15,590,505,527.0 15,590,505,527.0
... ... ... ... 0.0 ... 0.0 ... 0.0 0 0.0 ... ... ... ... ... ... ... 0.0 ... 0.0 ... ... ...
EXPENSE ............................................................................................................................................................................
Compensation of employees ........................................................................................................................................
State Governments (6) Cash 920,747,126,974.9 531,506,015,765.0 531,506,015,765.0 188,989,386,787.9 175,186,323,922.0 175,186,323,922.0 175,186,323,922.0 25,065,400,500.0 25,065,400,500.0 25,065,400,500.0
0 a/ ... 0.0 ... 0.0 ... ... 0.0 ... 0.0 0.0 ... 0.0 0.0 0.0 ... 0.0 ... 0.0 ... ... 0.0 ... 0.0 ... ... ... ... ... ...
General Government Central Government Central Government (5) Cash 6,998,777,324,639.0 828,428,321,514.0 828,428,321,514.0 715,640,940,357.0 Grants .......................................................................................................................................................................................... 535,158,737,171.0 5,383,360,608,521.0 5,383,360,608,521.0 5,383,360,608,521.0 5,312,400,000.0 5,306,400,000.0 6,000,000
... Use of goods and services ...................................................................................................................................... Consumption of fixed capital .......................................................................................................................... ... Interest ....................................................................................................................
Accounting method: Wages and salaries ......................................................................................................... Social contributions ..................................................................................................................... Actual social contributions ........................................................................................................... Imputed social contributions ..........
EXPENSE
2 21 211 212 2121 2122 22 23 24 241 242 243 25 251 252 26 261 2611 2612 262 2621 2622 263 2631 2632 27 271 272 273 28 281 282 2821 2822