
Page 99 - GFS2019 Semster I
P. 99
1
0.0
0.0
0.0
0.0
0.0
0.0
0.0
0.0
Consolidated Nonfinancial (12)
NFPS Public Sector Non Cash 9,004,581,967,124.8 1,014,395,469,177.3 339,196,945,746.0 7,650,989,552,201.5 5,910,746,788,383.5 3,060,251,495,424.4 1,607,943,542,908.1 1,127,247,659,777.0 8,613,130,000.0 106,690,960,274.0 3,093,835,178,741.3 3,093,835,178,741.3 339,977,616,396.0 324,239,720,396.0 15,737,896,000.0 2,753,857,562,345.3 2,746,860,818,582.3 2,746,860,818,582.3 -6,996,743,763.0 -6,996,743,763.0
...
Consoli dation Column (11) Non Cash ... ... ... ... ... ... ... ... ... ... ... ... ... ... ... ... ... ... ... ... ... ... ... ... ... ... ... ... ...
Nonfinancia l public corporation s (10) Non Cash 0.0 ... ... ... 0.0 0.0 0.0 0.0 0.0 0.0 ... ... ... 0.0 0.0 0.0 0.0 0.0 0.0 0.0 0.0 0.0 0.0 0.0 ... 0.0 0.0 ... 0.0
b/ 9,004,581,967,124.8 1,014,395,469,177.3 339,196,945,746.0 7,650,989,552,201.5 5,910,746,788,383.5 3,060,251,495,424.4 1,607,943,542,908.1 0.0 0.0 1,127,247,659,777.0 8,613,130,000.0 106,690,960,274.0 3,093,835,178,741.3 3,093,835,178,741.3 339,977,616,396.0 324,239,720,396.0 0.0 15,737,896,000.0 2,753,857,562,345.3 2,746,860,818,582.3 2,746,860,818,582.3 0.0 -6,996,743,763.0 -6,996,743,763.0 0.0 0.0
General Government (9) Non Cash
... ... 0.0 0.0 ... 0.0 0.0
Consolidation Column (8) Non Cash -4,966,458,009,837.0 -4,966,458,009,837.0 -4,966,458,009,837.0 -4,966,458,009,837.0
... ... ... ... ... ... ... 0.0 ... 0.0 ... ... ... ... ... 0.0 ... ... ... ... ... ... ... ... 0.0 0.0
Local Governments (7) Non Cash 4,450,227,646,280.1 83,748,794,189.3 4,140,671,513,659.0 225,807,338,431.8 2,957,680,346,606.6 1,700,317,158,145.4 703,313,215,763.1 535,158,737,171.0 3,300,730,000.0 15,590,505,527.0 1,492,547,299,673.5 1,492,547,299,673.5 122,844,636,785.8 109,414,740,785.8 13,429,896,000.0 1,369,702,662,888 1,362,705,919,124.7 1,362,705,919,124.7 -6,996,743,763.0 -6,996,743,763.0 7/29/2019 2:50 PM
... ... 0.0 0.0 0.0 0.0 ... 0 ... 0.0 0.0 0.0
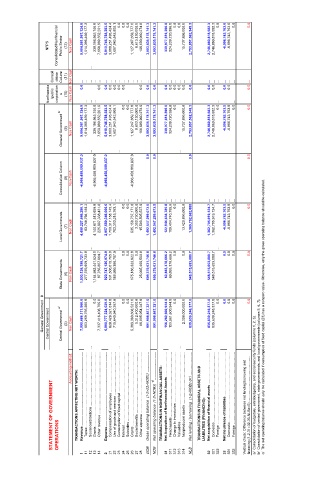
Revenue ....................................................................................................................................................................................
State Governments (6) Non Cash 1,530,126,158,721.7 277,376,909,733.0 1,164,983,441,924.0 87,765,807,064.7 920,747,126,974.9 531,506,015,765.0 188,989,386,787.9 175,186,323,922.0 25,065,400,500.0 609,379,031,746.8 609,379,031,746.8 60,863,378,666.2 60,863,378,666.2 548,515,653,080.7 548,515,653,080.7 548,515,653,080.7
0 ... 0.0 ... 0.0 0.0 0.0 ... ... 0.0 0.0 0.0 0.0 0.0 only be calculated if consumption of fixed capital (23) has a nonzero value. Otherwise, only the gross operating balance should be calculated.
General Government Central Government a/ Central Government (5) Non Cash 7,990,686,171,960.0 653,269,765,255.0 7,337,416,406,705.0 6,998,777,324,639.0 828,428,321,514.0 715,640,940,357.0 5,383,360,608,521.0 5,312,400,000.0 66,035,054,247.0 991,908,847,321.0 c/ ............................................................................................................................................... 991,908,847,321.0 156,269,600,944.0 153,961,60
... Taxes ..................................................................................................................................................................................... Social contributions ..................................................................................................................................................... Grants ...............................................................................
Accounting method: a/ Consolidation of budgetary, extrabudgetary, and social security funds (columns 1, 2, 3). b/ Consolidation of central government, state governments, and local governments (columns 5, 6, 7).
STATEMENT OF GOVERNMENT TRANSACTIONS AFFECTING NET WORTH: Net operating balance (1-2+NOBz) TRANSACTIONS IN NONFINANCIAL ASSETS: TRANSACTIONS IN FINANCIAL ASSETS AND LIABILITIES (FINANCING): Vertical check: Difference between net lending/borrowing and financing (1-2-31=32-33-NLBz=0) ............................................... c/ The net operating balance should
OPERATIONS
1 11 12 13 14 2 21 22 23 24 25 26 27 28 GOB NOB 31 311 312 313 314 NLB 32 321 322 33 331 332