
Page 273 - eProceeding for IRSTC2017 and RESPeX2017
P. 273
Masliana, Nurul Izzah/ JOURNAL ONLINE JARINGAN COT POLIPD
Information search is also unlimited as teaching materials can be chosen by the students themselves whether perceived
appropriate or not. In addition to these two learning methods, Blended Learning (BL) is another branch of learning that begins to
grow and becomes the preferred choice of educators. This is in line with the technological developments that allow students and
lecturers to interact and communicate online. According to a study conducted by D. Randy Garrison in 2004, he concluded that
blended learning is as important as traditional learning in higher learning institutions. He also proved that blended learning has
the potential to produce effective learning experiences.
There are several researchers who conduct research on e-learning. The study conducted by Rubiah and Jamilah (2009) found
that academics at USM already had a positive awareness of e-learning in the teaching and learning system although some
respondents did not support the stated e-learning concepts. While the study conducted by Ida Rahayu (2011) found CIDOS-based
level of readiness and awareness for lecturers at the Department of Mathematics, Science and Computer (JMSK), Politeknik
Sultan Abdul Halim Muazzam Shah is at high level which the average mean is 3.96 and 4.09. This is supported by a study
conducted by Abdul Razaq (2010) which conclude that one who wants to use the online teaching should conduct an assessment
to level of readiness of the student to learn and level of competency to computer application.
3.0 Methodology of study
This study is a quantitative study that studies the perceptions of lecturers in JKM, POLISAS. Data obtained are categorized as
quantitative as the data analysis method uses frequency and percentage and min score analysis. The research method used is
descriptive research method of sample survey. According to Mohd Majid Konting (2000), descriptive research is a research that
aims to explain a phenomenon that is taking place. Sample survey study is a survey conducted on the part of the population
studied and random samples used to represent the population being studied.
3.1 Population and Sample of Study
The population is the target group of researchers, which is the group to whom the results will be generalized (Gay and Air,
2003). The sample was the respondents selected to represent a population. The determination of the population of the study is
important in the study because the population will determine how and how many samples will be choosen as well as the
expenditure of the study. A total of 59 lecturers were randomly selected as respondents from 71 lecturers in JKM. The suitability
of this sample refers to Krejeie and Morgan (1970) tables.
3.2 Instrument of Study
This study is a descriptive survey study. Questionnaire was used to obtain information from respondents. The questionnaire is
more practical and effective for large populations as it can measure a large sample size and will increase the accuracy of sample
to estimate population parameters (Mohd Majid, 1990). This research questionnaire consists of 28 items which contains into
several sections. According to Kamarudin & Roslim (1990), the purpose of the questionnaire was to obtain accurate and
complete information.
3.2.1 Methods of Data Analysis
All questionnaire items were analyzed using the IBM SPSS Statistical 20 software. Descriptive data analysis methods were
used to describe information pertaining to research questions. To achieve that goal, mean analysis and standard deviation are
used to illustrate the descriptive score distribution of each item. To measure the level, respondents' responses were classified into
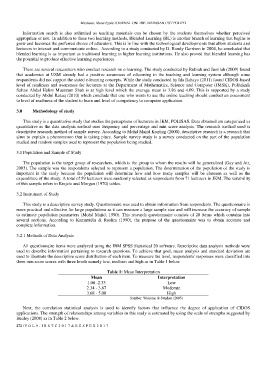
three min score scores with three levels namely low, medium and high as in Table 1 below
Table 1: Mean Interpretation
Mean Interpretation
1.00 -2.33 Low
2.34 - 3.67 Moderate
3.68 - 5.00 High
Sumber: Wiersma & Stephen (2005)
Next, the correlation statistical analysis is used to identify factors that influence the degree of application of CIDOS
applications. The strength of relationships among variables in this study is estimated by using the scale of strengths suggested by
Healey (2008) as in Table 2 below.
272 | V O L 9 - I R S T C 2 0 1 7 & R E S P E X 2 0 1 7