
Page 274 - eProceeding for IRSTC2017 and RESPeX2017
P. 274
Masliana, Nurul Izzah/ JOURNAL ONLINE JARINGAN COT POLIPD
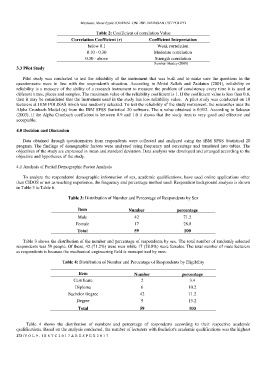
Table 2: Coefficient of correlation Value
Correlation Coefficient (r) Coefficient Intepretation
below 0.1 Weak correlation
0.10 - 0.30 Moderate correlation
0.30 - above Strength correlation
Sumber: Healey (2008)
3.3 Pilot Study
Pilot study was conducted to test the reliability of the instrument that was built and to make sure the questions in the
questionnaire were in line with the respondent's situation. According to Mohd Salleh and Zaidatun (2001), reliability or
reliability is a measure of the ability of a research instrument to measure the problem of consistency every time it is used at
different times, places and samples. The maximum value of the reliability coefficient is 1. If the coefficient value is less than 0.6,
then it may be considered that the instrument used in the study has low reliability value. A pilot study was conducted on 10
lecturers at JKM POLISAS which was randomly selected. To test the reliability of the study instrument, the researcher uses the
Alpha Cronbach Model (α) from the IBM SPSS Statistical 20 software. The α value obtained is 0.912. According to Sekaran
(2003), if the Alpha Cronbach coefficient is between 0.9 and 1.0 it shows that the study item is very good and effective and
acceptable.
4.0 Decision and Discussion
Data obtained through questionnaires from respondents were collected and analyzed using the IBM SPSS Statistical 20
program. The findings of demographic factors were analyzed using frequency and percentage and translated into tables. The
objectives of the study are expressed in mean and standard deviation. Data analysis was developed and arranged according to the
objective and hypotheses of the study.
4.1 Analysis of Partial Demographic Factor Analysis
To analyze the respondents' demographic information of sex, academic qualifications, have used online applications other
than CIDOS or not as teaching experience, the frequency and percentage method used. Respondent background analysis is shown
in Table 3 to Table 6.
Table 3: Distribution of Number and Percentage of Respondents by Sex
Item Number percentage
Male 42 71.2
Female 17 28.8
Total 59 100
Table 3 shows the distribution of the number and percentage of respondents by sex. The total number of randomly selected
respondents was 59 people. Of these, 42 (71.2%) were men while 17 (28.8%) were females. The total number of male lecturers
as respondents is because the mechanical engineering field is monopolized by men.
Table 4: Distribution of Number and Percentage of Respondents by Eligibility
Item Number percentage
Certificate 2 3.4
Diploma 6 10.2
Bachelor Degree 42 71.2
Degree 9 15.2
Total 59 100
Table 4 shows the distribution of numbers and percentage of respondents according to their respective academic
qualifications. Based on the analysis conducted, the number of lecturers with Bachelor's academic qualifications was the highest
273 | V O L 9 - I R S T C 2 0 1 7 & R E S P E X 2 0 1 7