
Page 275 - eProceeding for IRSTC2017 and RESPeX2017
P. 275
Masliana, Nurul Izzah/ JOURNAL ONLINE JARINGAN COT POLIPD
of 42 (71.2%). While 9 (15.2%) of the respondents had Master, followed by a Diploma of 6 (10.2%) and a Certificate of 2
(3.4%). Respondents with the Certificate and Diploma are the majority of lecturers who have been working for more than 20
years.
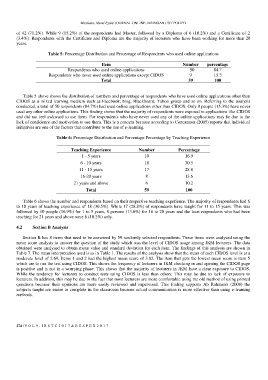
Table 5: Percentage Distribution and Percentage of Respondents who used online applications
Item Number percentage
Respondents who used online applications 50 84.7
Respondents who never used online applications except CIDOS 9 15.3
Total 59 100
Table 5 above shows the distribution of numbers and percentage of respondents who have used online applications other than
CIDOS as a mixed learning medium such as Facebook, blog, Blackboard, Yahoo group and so on. Referring to the analysis
conducted, a total of 50 respondents (84.7%) had used online applications other than CIDOS. Only 9 people (15.3%) have never
used any other online applications. This finding shows that the majority of respondents were exposed to applications like CIDOS
and did not feel awkward to use them. For respondents who have never used any of the online applications may be due to the
lack of confidence and motivation to use them. This is a concern because according to Concannon (2005) reports that individual
initiatives are one of the factors that contribute to the use of e-learning.
Table 6: Percentage Distribution and Percentage Percentage by Teaching Experience
Teaching Experience Number Percentage
1 - 5 years 10 16.9
6 - 10 years 18 30.5
11 - 15 years 17 28.8
16-20 years 8 13.6
21 years and above 6 10.2
Total 59 100
Table 6 shows the number and respondents based on their respective teaching experience. The majority of respondents had 6
to 10 years of teaching experience of 18 (30.5%). While 17 (28.8%) of respondents have taught for 11 to 15 years. This was
followed by 10 people (16.9%) for 1 to 5 years, 8 persons (13.6%) for 16 to 20 years and the least respondents who had been
teaching for 21 years and above were 6 (10.2%) only.
4.2 Section B Analysis
Section B has 8 items that need to be answered by 59 randomly selected respondents. These items were analyzed using the
mean score analysis to answer the question of the study which was the level of CIDOS usage among JKM lecturers. The data
obtained were analyzed to obtain mean value and standard deviation for each item. The findings of this analysis are shown in
Table 7. The mean interpretation used is as in Table 1. The results of the analysis show that the mean of each CIDOS level is at a
moderate level of 2.69. Items 1 and 2 had the highest mean score of 3.02. The item that gets the lowest mean score is item 5
which are to run the test using CIDOS. This shows the frequency of lecturers in JKM checking in and opening the CIDOS page
is positive and is not in a worrying phase. This shows that the majority of lecturers in JKM have a clear exposure to CIDOS.
While the tendency for lecturers to conduct tests using CIDOS is less than others. This may be due to lack of exposure to
lecturers. In addition, this may be due to the fact that most lecturers are more comfortable using the old method of using printed
questions because their opinions are more easily reviewed and supervised. This finding supports Ab Rahman's (2008) the
subjects taught are easier to complete in the classroom because actual communication is more effective than using e-learning
methods.
274 | V O L 9 - I R S T C 2 0 1 7 & R E S P E X 2 0 1 7