Page 166 - Cambridge+Checkpoint+Mathematics+Coursebook+9
P. 166

18 Graphs


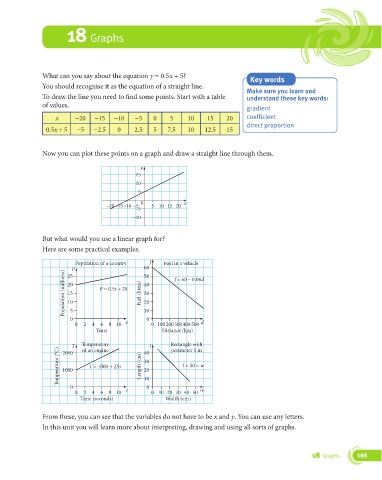
               What can you say about the equation y = 0.5x + 5?                     Key words
               You should recognise it as the equation of a straight line.         Make sure you learn and

               To draw the line you need to !nd some points. Start with a table    understand these key words:
               of values.                                                          gradient


                   x      −20    −15   −10    −5    0     5     10    15     20    coefficient
                                                                                   direct proportion
                0.5x + 5   −5   −2.5    0     2.5   5    7.5    10   12.5    15


               Now you can plot these points on a graph and draw a straight line through them.

                                                y
                                              15
                                              10
                                               5

                                                0             x
                                     –20–15 –10  –5  5 10  15  20
                                              –5
                                             –10


               But what would you use a linear graph for?
               Here are some practical examples.

                          Population of a country  f    Fuel in a vehicle
                         P                       60        f = 60 – 0.08d
                      Population (millions)  20  P = 0.5t + 20  Fuel (litres)  40
                        25
                                                 50
                        15
                                                 30
                                                 20
                        10
                        5
                        0                        10 0
                          0  2  4  6  8 10  t       0 100 200300 400 500  d
                                 Years                 Distance (km)


                         T  Temperature          40 l     Rectangle with
                    Temperature (°C)   1000  T = 1000 + 25s  Length (cm)  30  l = 50 – w
                            of an engine
                                                          perimeter 1 m
                      2000
                                                 20

                        0                        10 0
                          0  2  4  6  8 10  s       0 10  20 30  40 50  w
                            Time (seconds)              Width (cm)


               From these, you can see that the variables do not have to be x and y. You can use any letters.
               In this unit you will learn more about interpreting, drawing and using all sorts of graphs.


 18 Graphs                                                                                               18 Graphs      165
   161   162   163   164   165   166   167   168   169   170   171