
Page 26 - Business in Focus Annual Report 2017 v2
P. 26
BUSINESS IN FOCUSUSINESS IN FOCUS
ANNUAL REPORT 2016-2017AL REPORT 2016-2017
26 ANNU B 2727
26
FINANCIALS
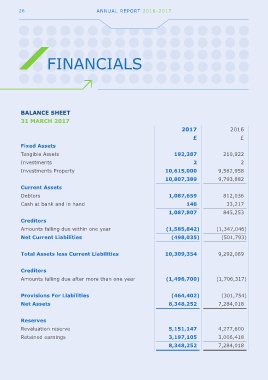
BALANCE SHEET PROFIT & LOSS ACCOUNT
31 MARCH 2017 YEAR ENDED 31 MARCH 2017
2017 2016 2017 2016
£ £ £ £
Fixed Assets Turnover 4,433,063 4,477,217
Tangible Assets 192,387 210,922 Cost of Sales (2,469,672) (1,842,202)
Investments 2 2
Investments Property 10,615,000 9,582,958 Gross Profit 1,963,391 2,635,015
10,807,389 9,793,882 Administrative expenses (1,652,110) (2,344,582)
Current Assets
Debtors 1,087,659 812,036 Operating Profit 311,281 290,433
Cash at bank and in hand 148 33,217 Interest receivable and similar income 48,734 42,729
1,087,807 845,253 360,015 333,162
Creditors
Amounts falling due within one year (1,585,842) (1,347,046) Gain/loss on revaluation of investment property 1,032,042 -
Net Current Liabilities (498,035) (501,793) 1,392,057 333,162
Total Assets less Current Liabilities 10,309,354 9,292,089 Interest payable and similar expenses (114,779) (143,360)
Profit Before Taxation 1,277,278 189,802
Creditors
Amounts falling due after more than one year (1,496,700) (1,706,317) Tax on Profit (213,044) (25,816)
Provisions For Liabilities (464,402) (301,754) Profit For The Financial Year 1,064,234 163,986
Net Assets 8,348,252 7,284,018
Reserves
Revaluation reserve 5,151,147 4,277,600
Retained earnings 3,197,105 3,006,418
8,348,252 7,284,018