
Page 27 - 201902 SCA February 2019 Volume 56 Number 1
P. 27
FEBRUARY
2019
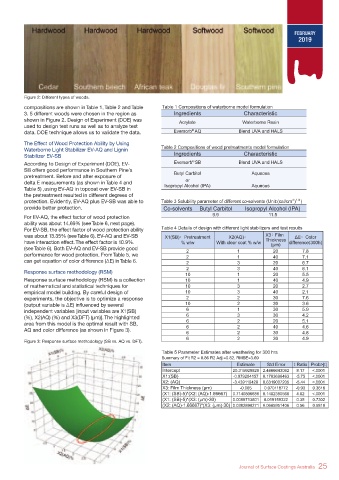
Figure 2: Different types of woods.
compositions are shown in Table 1, Table 2 and Table
3. 5 different woods were chosen in the region as
shown in Figure 2. Design of Experiment (DOE) was
used to design test runs as well as to analyze test
data. DOE technique allows us to validate the data.
The Effect of Wood Protection Ability by Using
Waterborne Light Stabilizer EV-AQ and Lignin
Stabilizer EV-SB
According to Design of Experiment (DOE), EV-
SB offers good performance in Southern Pine’s
pretreatment. Before and after exposure of
delta E measurements (as shown in Table 4 and
Table 5) ,using EV-AQ in topcoat over EV-SB in
the pretreatment resulted in different degrees of
protection. Evidently, EV-AQ plus EV-SB was able to
provide better protection.
For EV-AQ, the effect factor of wood protection
ability was about 14.69% (see Table 6, next page).
For EV-SB, the effect factor of wood protection ability
was about 13.35% (see Table 6). EV-AQ and EV-SB
have interaction effect. The effect factor is 10.9%.
(see Table 6). Both EV-AQ and EV-SB provide good
performance for wood protection. From Table 5, we
can get equation of color difference (ΔE) in Table 6.
Response surface methodology (RSM)
Response surface methodology (RSM) is a collection
of mathematical and statistical techniques for
empirical model building. By careful design of
experiments, the objective is to optimize a response
(output variable is ΔE) influenced by several
independent variables [input variables are X1(SB)
(%), X2(AQ) (%) and X3(DFT) (μm)]. The highlighted
area from this model is the optimal result with SB,
AQ and color difference (as shown in Figure 3).
Figure 3: Response surface methodology (SB vs. AQ vs. DFT).
Journal of Surface Coatings Australia 25