
Page 67 - Ultimate Guide to Currency Trading
P. 67
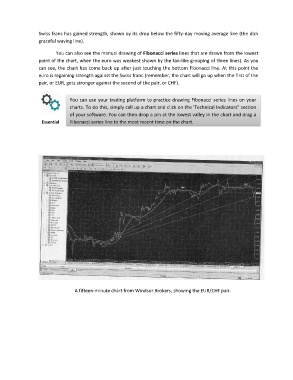
Swiss franc has gained strength, shown by its drop below the fifty-day moving average line (the dick
                 graceful waving line).

                        You can also see the manual drawing of Fibonacci series lines that are drawn from the lowest
                 point of the chart, when the euro was weakest shown by the fan-like grouping of three lines). As you
                 can see, the chart has come back up after just touching the bottom Fibonacci line. At this point the
                 euro is regaining strength against the Swiss franc (remember, the chart will go up when the first of the
                 pair, or EUR, gets stronger against the second of the pair, or CHF).


                              You can use your trading platform to practice drawing Fibonacci series lines on your
                              charts. To do this, simply call up a chart and click on the 'Technical Indicators" section

                              of your software. You can then drop a pin at the lowest valley in the chart and drag a

                  Essential    Fibonacci series line to the most recent time on the chart.


                                A fifteen-minute chart from Windsor Brokers, showing the EUR/CHF pair.