
Page 71 - Ultimate Guide to Currency Trading
P. 71
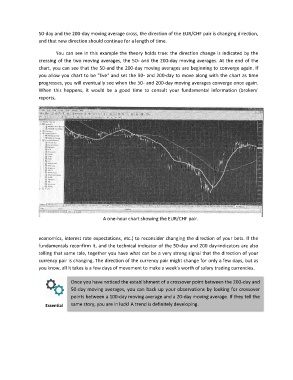
50-day and the 200-day moving average cross, the direction of the EUR/CHF pair is changing direction,
                 and that new direction should continue for a length of time.

                        You can see in this example the theory holds true: the direction change is indicated by the
                 crossing of the two moving averages, the 50- and the 200-day moving averages. At the end of the
                 chart, you can see that the 50-and the 200-day moving averages are beginning to converge again. If
                 you allow you chart to be "live" and set the 50- and 200-day to move along with the chart as time
                 progresses, you will eventually see when the 50- and 200-day moving averages converge once again.
                 When  this  happens,  it  would  be  a  good  time  to  consult  your  fundamental  information  (brokers'
                 reports,


                                            A one-hour chart showing the EUR/CHF pair.


                 economics, interest rate expectations, etc.) to reconsider changing the direction of your bets. If the
                 fundamentals reconfirm it, and the technical indicator of the 50-day and 200 day-indicators are also
                 telling that same tale, together you have what can be a very strong signal that the direction of your
                 currency pair is changing. The direction of the currency pair might change for only a few days, but as
                 you know, all it takes is a few days of movement to make a week's worth of salary trading currencies.


                               Once you have noticed the establishment of a crossover point between the 200-day and
                               50-day moving averages, you can back up your observations by looking for crossover
                                  points between a 100-day moving average and a 20-day moving average. If they tell the

                    Essential    same story, you are in luck! A trend is definitely developing.