Page 413 - ACFE Fraud Reports 2009_2020
P. 413
Distribution of Losses
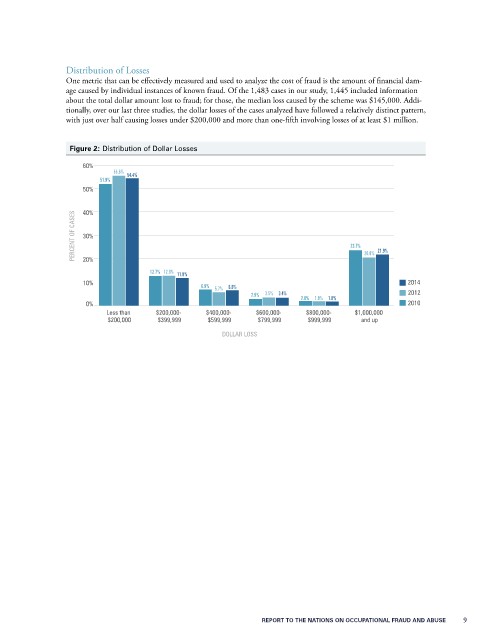
                 One metric that can be effectively measured and used to analyze the cost of fraud is the amount of financial dam-
                 age caused by individual instances of known fraud. Of the 1,483 cases in our study, 1,445 included information
                 about the total dollar amount lost to fraud; for those, the median loss caused by the scheme was $145,000. Addi-
                 tionally, over our last three studies, the dollar losses of the cases analyzed have followed a relatively distinct pattern,
                 with just over half causing losses under $200,000 and more than one-fifth involving losses of at least $1 million.


                  Figure 2: Distribution of Dollar Losses

                     60%
                             55.5%  54.4%
                          51.9%
                     50%


                     40%
                   PERCENT OF CASES  30%                                               23.7%  20.6%  21.9%


                     20%
                                      12.7% 12.8%  11.8%
                     10%                          6.9%  5.7%  6.6%                                   2014
                                                               2.9%  3.5% 3.4%  2.0% 1.9% 1.8%       2012
                      0%                                                                             2010
                           Less than   $200,000-    $400,000-   $600,000-   $800,000-   $1,000,000
                           $200,000     $399,999    $599,999    $799,999    $999,999      and up
                                                       DOLLAR LOSS


                                                                 REPORT TO THE NATIONS ON OCCUPATIONAL FRAUD AND ABUSE           9

