Page 461 - ACFE Fraud Reports 2009_2020
P. 461
Schemes Based on Perpetrator’s Department
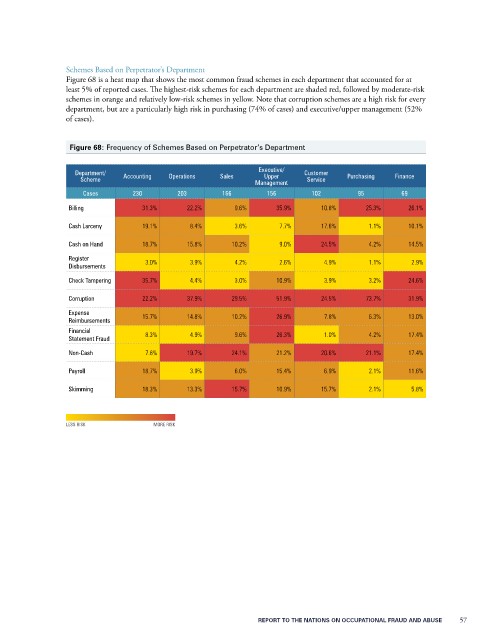
                 Figure 68 is a heat map that shows the most common fraud schemes in each department that accounted for at
                 least 5% of reported cases. The highest-risk schemes for each department are shaded red, followed by moderate-risk
                 schemes in orange and relatively low-risk schemes in yellow. Note that corruption schemes are a high risk for every
                 department, but are a particularly high risk in purchasing (74% of cases) and executive/upper management (52%
                 of cases).


                  Figure 68: Frequency of Schemes Based on Perpetrator’s Department

                                                                Executive/
                   Department/  Accounting  Operations  Sales     Upper     Customer   Purchasing  Finance
                     Scheme                                                 Service
                                                                Management
                     Cases        230        203       166        156        102         95        69
                  Billing           31.3%      22.2%       9.6%      35.9%      10.8%      25.3%     26.1%

                  Cash Larceny      19.1%       8.4%       3.6%       7.7%      17.6%      1.1%      10.1%

                  Cash on Hand      18.7%      15.8%      10.2%       9.0%      24.5%      4.2%      14.5%
                  Register           3.0%       3.9%       4.2%       2.6%      4.9%       1.1%       2.9%
                  Disbursements
                  Check Tampering   35.7%       4.4%       3.0%      10.9%      3.9%       3.2%      24.6%

                  Corruption        22.2%      37.9%      29.5%      51.9%      24.5%      73.7%     31.9%
                  Expense           15.7%      14.8%      10.2%      26.9%      7.8%       6.3%      13.0%
                  Reimbursements
                  Financial
                  Statement Fraud    8.3%       4.9%       9.6%      26.3%      1.0%       4.2%      17.4%
                  Non-Cash           7.8%      19.7%      24.1%      21.2%      20.6%      21.1%     17.4%

                  Payroll           18.7%       3.9%       6.0%      15.4%      6.9%       2.1%      11.6%

                  Skimming          18.3%      13.3%      15.7%      10.9%      15.7%      2.1%       5.8%


                 LESS RISk                                                          MORE RISk


                                                                REPORT TO THE NATIONS ON OCCUPATIONAL FRAUD AND ABUSE           57

