Page 459 - ACFE Fraud Reports 2009_2020
P. 459
Perpetrator’s Department
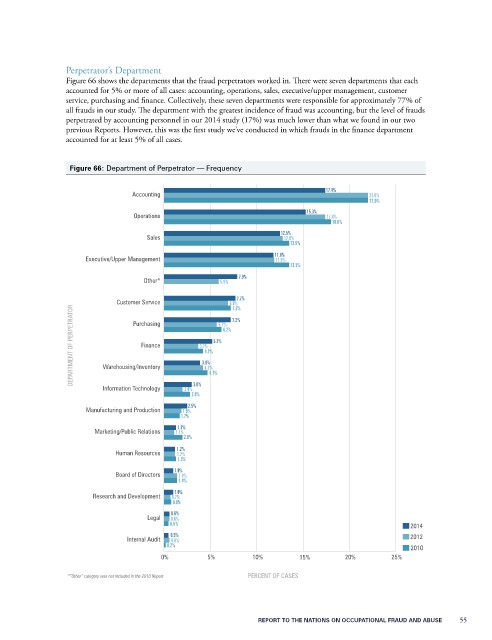
                 Figure 66 shows the departments that the fraud perpetrators worked in. There were seven departments that each
                 accounted for 5% or more of all cases: accounting, operations, sales, executive/upper management, customer
                 service, purchasing and finance. Collectively, these seven departments were responsible for approximately 77% of
                 all frauds in our study. The department with the greatest incidence of fraud was accounting, but the level of frauds
                 perpetrated by accounting personnel in our 2014 study (17%) was much lower than what we found in our two
                 previous Reports. However, this was the first study we’ve conducted in which frauds in the finance department
                 accounted for at least 5% of all cases.


                  Figure 66: Department of Perpetrator — Frequency

                                                                                 17.4%
                                 Accounting                                                 22.0%
                                                                                            22.0%
                                                                            15.3%
                                  Operations                                     17.4%
                                                                                  18.0%
                                                                      12.5%
                                     Sales                             12.8%
                                                                        13.5%
                                                                    11.8%
                      Executive/Upper Management                     11.9%
                                                                        13.5%
                                                            7.9%
                                    Other*             5.9%
                                                           7.7%
                              Customer Service           6.9%
                                                          7.2%
                   DEPARTMENT OF PERPETRATOR  Warehousing/Inventory  3.7% 4.2% 5.2% 5.7%
                                                          7.2%
                                  Purchasing
                                                        6.2%
                                    Finance

                                                   3.9%


                          Information Technology  2.0% 3.0%  4.2% 4.7%
                                                2.8%
                                               2.5%
                      Manufacturing and Production  1.9%
                                             1.7%
                                            1.3%
                        Marketing/Public Relations  1.1%
                                              2.0%
                                            1.2%
                             Human Resources  1.2%
                                             1.3%
                                            1.0%
                             Board of Directors  1.4%
                                             1.4%
                                            1.0%
                        Research and Development  0.7%
                                           0.8%
                                           0.6%
                                     Legal  0.6%
                                           0.5%                                                       2014
                                           0.5%                                                       2012
                                Internal Audit  0.6%
                                          0.2%                                                        2010
                                         0%         5%         10%        15%         20%        25%


                  *”Other” category was not included in the 2010 Report.  PERCENT OF CASES


                                                                REPORT TO THE NATIONS ON OCCUPATIONAL FRAUD AND ABUSE           55

