Page 454 - ACFE Fraud Reports 2009_2020
P. 454
Median Losses Based on Gender
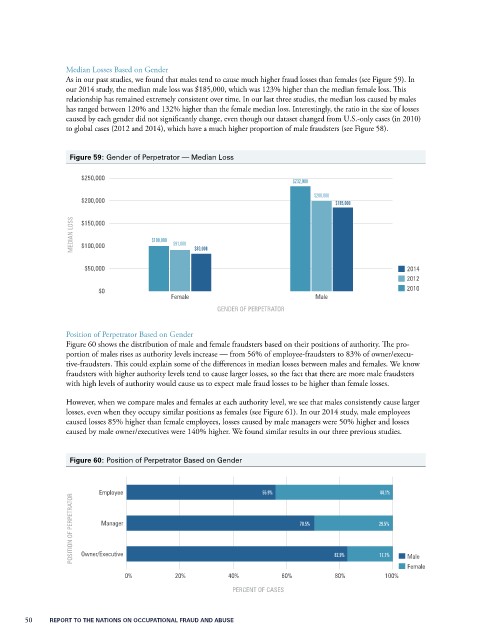
                 As in our past studies, we found that males tend to cause much higher fraud losses than females (see Figure 59). In
                 our 2014 study, the median male loss was $185,000, which was 123% higher than the median female loss. This
                 relationship has remained extremely consistent over time. In our last three studies, the median loss caused by males
                 has ranged between 120% and 132% higher than the female median loss. Interestingly, the ratio in the size of losses
                 caused by each gender did not significantly change, even though our dataset changed from U.S.-only cases (in 2010)
                 to global cases (2012 and 2014), which have a much higher proportion of male fraudsters (see Figure 58).


                  Figure 59: Gender of Perpetrator — Median Loss


                     $250,000
                                                                         $232,000
                                                                              $200,000
                     $200,000                                                      $185,000

                   MEDIAN LOSS  $150,000  $100,000  $91,000  $83,000


                     $100,000

                      $50,000                                                                        2014
                                                                                                     2012
                         $0                                                                          2010
                                           Female                             Male
                                                      GENDER OF PERPETRATOR

                 Position of Perpetrator Based on Gender
                 Figure 60 shows the distribution of male and female fraudsters based on their positions of authority. The pro-
                 portion of males rises as authority levels increase — from 56% of employee-fraudsters to 83% of owner/execu-
                 tive-fraudsters. This could explain some of the differences in median losses between males and females. We know
                 fraudsters with higher authority levels tend to cause larger losses, so the fact that there are more male fraudsters
                 with high levels of authority would cause us to expect male fraud losses to be higher than female losses.

                 However, when we compare males and females at each authority level, we see that males consistently cause larger
                 losses, even when they occupy similar positions as females (see Figure 61). In our 2014 study, male employees
                 caused losses 85% higher than female employees, losses caused by male managers were 50% higher and losses
                 caused by male owner/executives were 140% higher. We found similar results in our three previous studies.


                  Figure 60: Position of Perpetrator Based on Gender


                         Employee                                55.9%                        44.1%
                   POSITION OF PERPETRATOR  Manager                        70.5%              29.5%


                     Owner/Executive
                                                                                   82.9%
                                                                                              17.1%
                                                                                                     Male
                                                                                                     Female
                                0%          20%          40%          60%          80%         100%
                                                          PERCENT OF CASES


       50           REPORT TO THE NATIONS ON OCCUPATIONAL FRAUD AND ABUSE

