Page 453 - ACFE Fraud Reports 2009_2020
P. 453
Perpetrator’s Gender
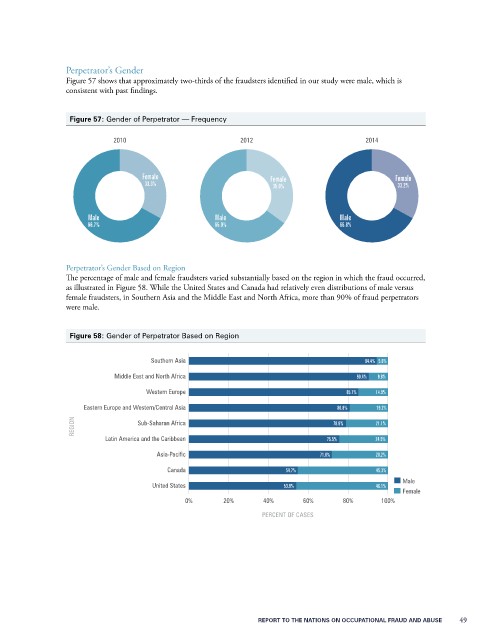
                 Figure 57 shows that approximately two-thirds of the fraudsters identified in our study were male, which is
                 consistent with past findings.


                  Figure 57: Gender of Perpetrator — Frequency
                                                                          A
                                           A
                                                                          65
                                                                          +
                                                                          +
                                           +
                                           +
                 33 3533                                                                                 + 67 + A
                                           67
                                                                                           2014
                             2010
                                                            2012
                                    Female
                                                                                                  Female
                                                                   Female
                                    33.3%
                                                                                                  33.2%
                                                                    35.0%
                                                      Male
                       Male
                                                                                    Male
                       66.7%
                 Perpetrator’s Gender Based on Region  65.0%                        66.8%
                 The percentage of male and female fraudsters varied substantially based on the region in which the fraud occurred,
                 as illustrated in Figure 58. While the United States and Canada had relatively even distributions of male versus
                 female fraudsters, in Southern Asia and the Middle East and North Africa, more than 90% of fraud perpetrators
                 were male.


                  Figure 58: Gender of Perpetrator Based on Region

                                      Southern Asia                                       94.4% 5.6%

                             Middle East and North Africa                               90.4%  9.6%
                                     Western Europe                                   85.1%  14.9%

                      Eastern Europe and Western/Central Asia                       80.8%    19.2%
                   REGION          Sub-Saharan Africa                              78.9%     21.1%
                           Latin America and the Caribbean                       75.5%       24.5%

                                       Asia-Pacific                            71.8%         28.2%
                                          Canada                       54.7%                 45.3%
                                                                                                    Male
                                      United States                    53.9%                 46.1%
                                                                                                    Female
                                              0%        20%       40%      60%       80%      100%
                                                                 PERCENT OF CASES


                                                                REPORT TO THE NATIONS ON OCCUPATIONAL FRAUD AND ABUSE           49

