Page 455 - ACFE Fraud Reports 2009_2020
P. 455

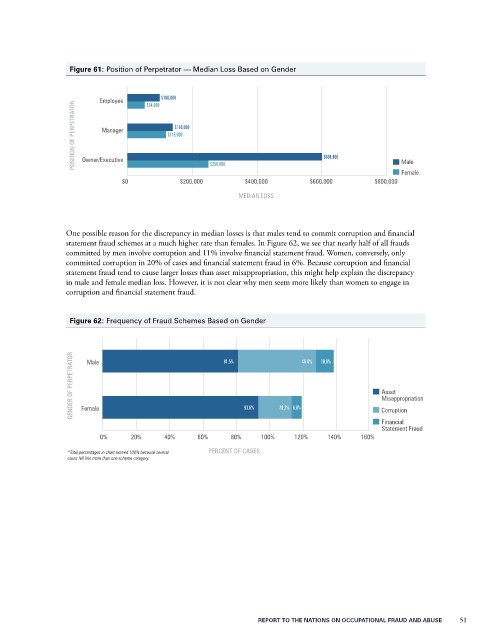
Figure 61: Position of Perpetrator — Median Loss Based on Gender


                         Employee    $54,000  $100,000
                   POSITION OF PERPETRATOR  Manager  $119,000

                                            $140,000


                                                                                $600,000
                     Owner/Executive
                                                                                                   Male
                                                     $250,000
                                                                                                   Female
                               $0            $200,000        $400,000        $600,000        $800,000
                                                            MEDIAN LOSS


                 One possible reason for the discrepancy in median losses is that males tend to commit corruption and financial
                 statement fraud schemes at a much higher rate than females. In Figure 62, we see that nearly half of all frauds
                 committed by men involve corruption and 11% involve financial statement fraud. Women, conversely, only
                 committed corruption in 20% of cases and financial statement fraud in 6%. Because corruption and financial
                 statement fraud tend to cause larger losses than asset misappropriation, this might help explain the discrepancy
                 in male and female median loss. However, it is not clear why men seem more likely than women to engage in
                 corruption and financial statement fraud.


                  Figure 62: Frequency of Fraud Schemes Based on Gender


                   GENDER OF PERPETRATOR  Male          81.5%              46.8%  10.6%        Asset


                                                                                               Misappropriation
                                                                     20.2% 6.0%
                     Female
                                                             93.6%
                                                                                              Corruption
                                                                                               Financial
                                                                                               Statement Fraud
                          0%     20%     40%     60%      80%    100%    120%    140%    160%
                  *Total percentages in chart exceed 100% because several   PERCENT OF CASES
                  cases fell into more than one scheme category.


                                                                REPORT TO THE NATIONS ON OCCUPATIONAL FRAUD AND ABUSE           51
   450   451   452   453   454   455   456   457   458   459   460