Page 553 - ACFE Fraud Reports 2009_2020
P. 553
Perpetrators


                 Behavioral Red Flags Based on Perpetrator’s Position
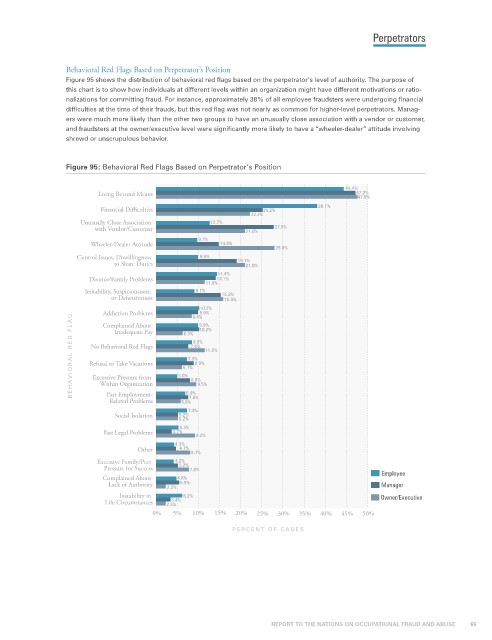
                 Figure 95 shows the distribution of behavioral red flags based on the perpetrator’s level of authority. The purpose of
                 this chart is to show how individuals at different levels within an organization might have different motivations or ratio-
                 nalizations for committing fraud. For instance, approximately 38% of all employee fraudsters were undergoing financial
                 difficulties at the time of their frauds, but this red flag was not nearly as common for higher-level perpetrators. Manag-
                 ers were much more likely than the other two groups to have an unusually close association with a vendor or customer,
                 and fraudsters at the owner/executive level were significantly more likely to have a “wheeler-dealer” attitude involving
                 shrewd or unscrupulous behavior.


                 Figure 95: Behavioral Red Flags Based on Perpetrator’s Position

                                                                                      44.4%
                         Living Beyond Means                                            47.2%
                                                                                         47.6%
                          Financial Difficulties                    25.2%        38.1%
                                                               22.2%
                     Unusually Close Association     12.7%
                        with Vendor/Customer                 21.0%  27.8%
                                                  9.7%
                       Wheeler-Dealer Attitude         14.8%
                                                                     28.0%
                    Control Issues, Unwillingness   9.9%   19.1%
                             to Share Duties                 21.0%
                                                      14.4%
                       Divorce/Family Problems        14.1%
                                                   11.5%
                      Irritability, Suspiciousness,   9.1%  15.3%
                            or Defensiveness            15.9%
                                                  10.2%
                          Addiction Problems  6.3% 8.4% 9.9%
                                                  9.9%
                   BEHA VIORAL RED FLA G  Refusal to Take Vacations  5.0% 7.3% 8.9% 11.5%
                          Complained About
                                                  10.2%
                             Inadequate Pay
                                                8.5%
                       No Behavioral Red Flags
                                                7.6%
                                              6.1%
                        Excessive Pressure from
                                                8.0%
                          Within Organization
                                               6.9%
                           Past Employment-
                            Related Problems  5.8% 7.6% 9.5%
                                               7.3%
                             Social Isolation  5.2%
                                             5.2%
                                             5.3%
                          Past Legal Problems  3.7%  9.2%
                                            4.3%
                                   Other     4.7%
                                                8.1%
                         Excessive Family/Peer   4.2%
                                             5.2%
                           Pressure for Success  7.8%
                          Complained About   4.8%                                              Employee
                            Lack of Authority  2.3%  5.5%                                     Manager
                              Instability in   6.2%                                           Owner/Executive
                                           3.4%
                           Life Circumstances  2.3%
                                      0%   5%   10%   15%  20%  25%  30%  35%  40%   45%  50%
                                                          PERCENT OF CASES


                                                                    REPORT TO THE NATIONS ON OCCUPATIONAL FRAUD AND ABUSE           69

