Page 559 - ACFE Fraud Reports 2009_2020
P. 559

Case Results


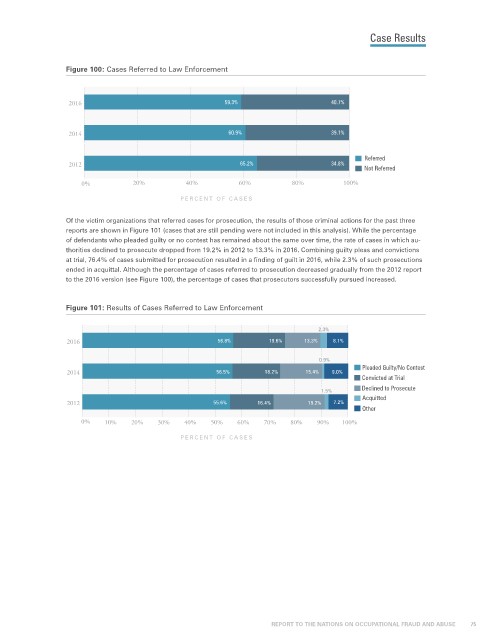
                 Figure 100: Cases Referred to Law Enforcement


                  2016                                  59.3%                     40.7%


                  2014                                   60.9%                    39.1%


                                                                                          Referred
                  2012                                      65.2%                 34.8%
                                                                                          Not Referred
                     0%           20%          40%          60%          80%         100%
                                             PERCENT OF CASES

                 Of the victim organizations that referred cases for prosecution, the results of those criminal actions for the past three
                 reports are shown in Figure 101 (cases that are still pending were not included in this analysis). While the percentage
                 of defendants who pleaded guilty or no contest has remained about the same over time, the rate of cases in which au-
                 thorities declined to prosecute dropped from 19.2% in 2012 to 13.3% in 2016. Combining guilty pleas and convictions
                 at trial, 76.4% of cases submitted for prosecution resulted in a finding of guilt in 2016, while 2.3% of such prosecutions
                 ended in acquittal. Although the percentage of cases referred to prosecution decreased gradually from the 2012 report
                 to the 2016 version (see Figure 100), the percentage of cases that prosecutors successfully pursued increased.


                 Figure 101: Results of Cases Referred to Law Enforcement


                                                                               2.3%
                 2016                                 56.8%        19.6%    13.3%  8.1%
                                                                               0.9%
                                                                                          Pleaded Guilty/No Contest
                 2014                                 56.5%       18.2%     15.4%  9.0%
                                                                                          Convicted at Trial
                                                                                1.5%      Declined to Prosecute
                                                                                          Acquitted
                 2012                                55.6%      16.4%       19.2%  7.2%
                                                                                          Other
                     0%    10%   20%    30%   40%    50%   60%    70%   80%    90%   100%
                                             PERCENT OF CASES


                                                                    REPORT TO THE NATIONS ON OCCUPATIONAL FRAUD AND ABUSE           75
   554   555   556   557   558   559   560   561   562   563   564