Page 561 - ACFE Fraud Reports 2009_2020
P. 561

Case Results


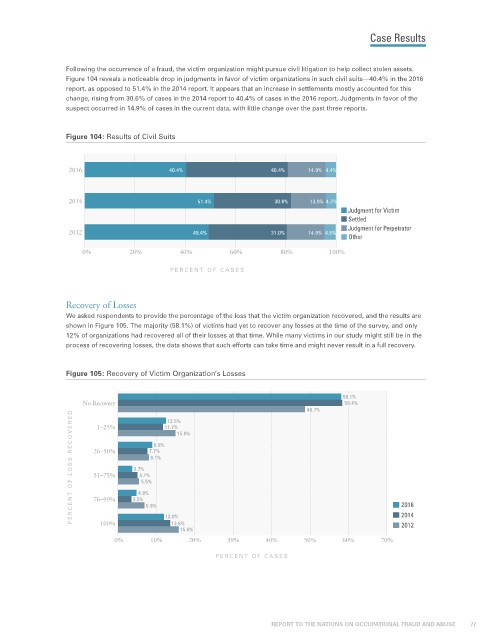
                 Following the occurrence of a fraud, the victim organization might pursue civil litigation to help collect stolen assets.
                 Figure 104 reveals a noticeable drop in judgments in favor of victim organizations in such civil suits—40.4% in the 2016
                 report, as opposed to 51.4% in the 2014 report. It appears that an increase in settlements mostly accounted for this
                 change, rising from 30.6% of cases in the 2014 report to 40.4% of cases in the 2016 report. Judgments in favor of the
                 suspect occurred in 14.9% of cases in the current data, with little change over the past three reports.


                 Figure 104: Results of Civil Suits


                  2016                     40.4%                   40.4%     14.9% 4.4%


                  2014                           51.4%              30.6%    13.9% 4.2%
                                                                                      Judgment for Victim
                                                                                      Settled
                                                                                      Judgment for Perpetrator
                  2012                          49.4%              31.0%     14.9% 4.6%
                                                                                      Other
                     0%          20%         40%         60%          80%         100%

                                           PERCENT OF CASES


                 Recovery of Losses
                 We asked respondents to provide the percentage of the loss that the victim organization recovered, and the results are
                 shown in Figure 105. The majority (58.1%) of victims had yet to recover any losses at the time of the survey, and only
                 12% of organizations had recovered all of their losses at that time. While many victims in our study might still be in the
                 process of recovering losses, the data shows that such efforts can take time and might never result in a full recovery.


                 Figure 105: Recovery of Victim Organization’s Losses


                                                                                     58.1%
                     No Recovery                                                     58.4%
                                                                            48.7%
                   PERCENT OF L OSS RECO VERED  26–50%  3.7% 5.5% 7.7%
                                          12.5%
                         1–25%
                                         11.7%
                                            15.0%
                                       8.9%
                                      8.1%
                        51–75%
                                   5.1%
                                   4.8%
                        76–99%
                                  3.5%
                                     6.9%
                                                                                                   2014
                                         12.0%
                          100%
                                           13.6%
                                                                                                   2012
                                             15.8%                                                 2016
                             0%       10%      20%       30%      40%       50%      60%      70%
                                                      PERCENT OF CASES


                                                                    REPORT TO THE NATIONS ON OCCUPATIONAL FRAUD AND ABUSE           77
   556   557   558   559   560   561   562   563   564   565   566