Page 565 - ACFE Fraud Reports 2009_2020
P. 565
Methodology


                 Analysis Methodology
                 In calculating the percentages discussed throughout this report, we used the total number of complete and relevant
                 responses for the question(s) being analyzed. Specifically, we excluded any blank responses or instances where the
                 participant indicated that he or she did not know the answer to a question. Consequently, the total number of cases
                 included in each analysis varies.

                 In addition, several survey questions allowed participants to select more than one answer. Therefore, the sum of per-
                 centages in many figures throughout the report exceeds 100%.

                 Unless otherwise indicated, all loss amounts discussed throughout the report are calculated using median loss rather
                 than mean, or average, loss. Average losses were skewed by a limited number of very high-dollar frauds. Using median
                 loss provides a more conservative—and we believe more accurate—picture of the typical impact of occupational
                 fraud schemes. Additionally, we excluded median loss calculations for categories for which there were fewer than 10
                 responses.
                 Because the direct losses caused by financial statement frauds are typically spread among numerous stakeholders,
                 obtaining an accurate estimate for this amount is extremely difficult. Consequently, for schemes involving financial
                 statement fraud, we asked survey participants to provide the gross amount of the financial statement misstatement
                 (over- or under-statement) involved in the scheme. All losses reported for financial statement frauds throughout this
                 report are based on those reported amounts.

                 Who Provided the Data?
                 To provide context for the survey responses and to understand who investigates cases of occupational fraud, we asked
                 respondents to provide certain information about their professional experience and qualifications.

                 Primary Occupation
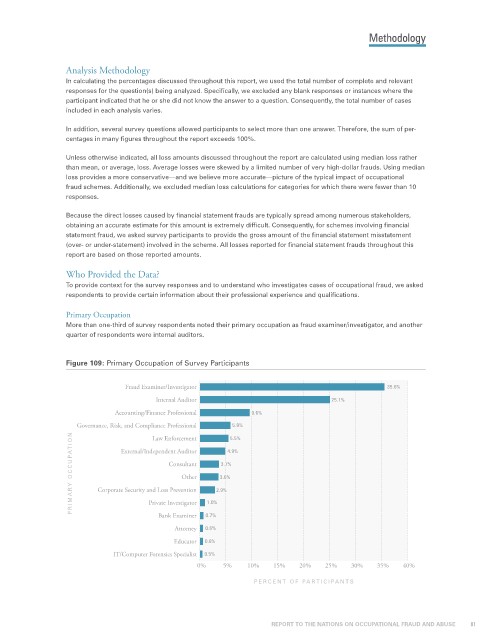
                 More than one-third of survey respondents noted their primary occupation as fraud examiner/investigator, and another
                 quarter of respondents were internal auditors.


                 Figure 109: Primary Occupation of Survey Participants

                                Fraud Examiner/Investigator                                     35.6%
                                       Internal Auditor                           25.1%
                             Accounting/Finance Professional   9.6%
                                                          5.9%
                    Governance, Risk, and Compliance Professional  5.5%
                   PRIMAR Y OCCUPATION  Corporate Security and Loss Prevention  2.9% 4.9%
                                      Law Enforcement
                               External/Independent Auditor
                                          Consultant
                                                       3.7%
                                              Other
                                                       3.6%

                                     Private Investigator
                                                    1.0%
                                        Bank Examiner  0.7%
                                            Attorney  0.6%
                                            Educator  0.6%
                             IT/Computer Forensics Specialist  0.5%
                                                 0%     5%    10%   15%   20%    25%   30%   35%    40%
                                                               PERCENT OF PARTICIPANTS


                                                                    REPORT TO THE NATIONS ON OCCUPATIONAL FRAUD AND ABUSE           81

