
Page 699 - ACFE Fraud Reports 2009_2020
P. 699
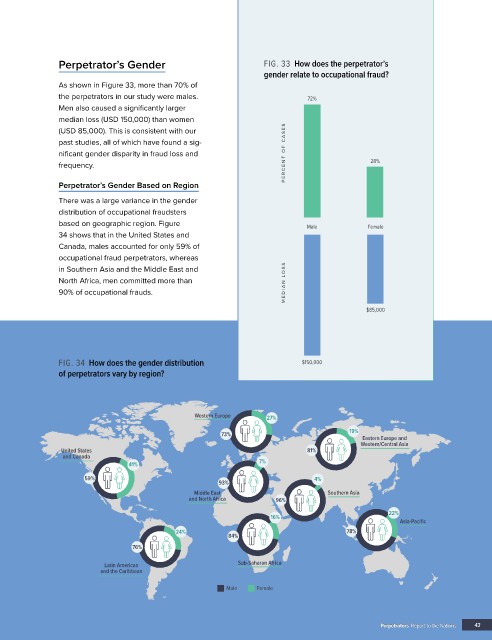
Perpetrator’s Gender                               FIG. 33  How does the perpetrator’s
                                                                  gender relate to occupational fraud?
               As shown in Figure 33, more than 70% of
               the perpetrators in our study were males.                    72%
               Men also caused a significantly larger
               median loss (USD 150,000) than women
               (USD 85,000). This is consistent with our
               past studies, all of which have found a sig-
               nificant gender disparity in fraud loss and             PERCENT OF C A SES
               frequency.                                                                   28%

               Perpetrator’s Gender Based on Region

               There was a large variance in the gender
               distribution of occupational fraudsters
               based on geographic region. Figure                           Male           Female
               34 shows that in the United States and
               Canada, males accounted for only 59% of
               occupational fraud perpetrators, whereas
               in Southern Asia and the Middle East and
               North Africa, men committed more than                   MEDIAN L OSS
               90% of occupational frauds.

                                                                                           $85,000


               FIG. 34  How does the gender distribution                   $150,000
               of perpetrators vary by region?


                                                 Western Europe   27%

                                                       73%  ��                         19%  Eastern Europe and
                                                                                         Western/Central Asia
                                                                            81%
                and Canada                              �
                                 41%                             7%             �
                                                                                ��
                                                                             ��
                                                        ��
                      59%                             ��                      4%
                                                              ��
                                                              �                  Southern Asia
                                                       93%
                                               and North Africa      96%
                                                 Middle East ��
                                                                           ��
                                                                   16%     �                    22% Asia-Pacific
                      ��
                United States ��
                      �
                                            24%                                       78%
                                                         84%  ���                          ��
                                 76%  ��
                                                           Sub-Saharan Africa         ��
                                                                                      �
                          and the Caribbean
                                                          �
                                                          �
                                  �
                                  �
                           Latin American �
                                                         Male   Female
                                                                                                Perpetrators  Report to the Nations       43
                                                                                                Perpetrators  Report to the Nations