
Page 696 - ACFE Fraud Reports 2009_2020
P. 696
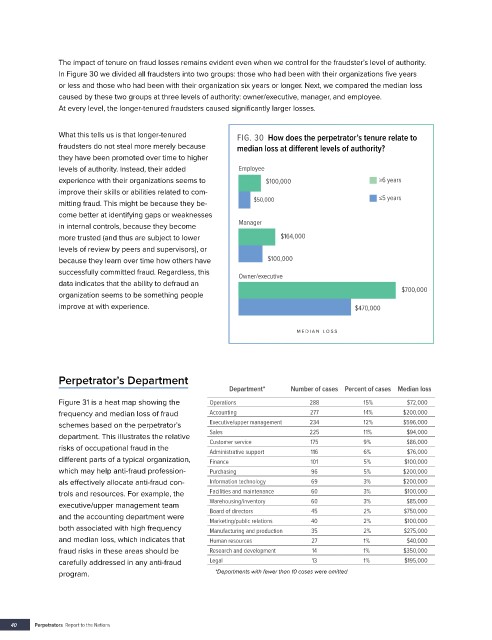
The impact of tenure on fraud losses remains evident even when we control for the fraudster’s level of authority.
               In Figure 30 we divided all fraudsters into two groups: those who had been with their organizations five years
               or less and those who had been with their organization six years or longer. Next, we compared the median loss
               caused by these two groups at three levels of authority: owner/executive, manager, and employee.
               At every level, the longer-tenured fraudsters caused significantly larger losses.


               What this tells us is that longer-tenured   FIG. 30  How does the perpetrator’s tenure relate to
               fraudsters do not steal more merely because   median loss at different levels of authority?
               they have been promoted over time to higher
               levels of authority. Instead, their added    Employee
               experience with their organizations seems to       $100,000                    ≥6 years
               improve their skills or abilities related to com-                              ≤5 years
               mitting fraud. This might be because they be-   $50,000
               come better at identifying gaps or weaknesses
               in internal controls, because they become    Manager
               more trusted (and thus are subject to lower            $164,000
               levels of review by peers and supervisors), or
               because they learn over time how others have        $100,000
               successfully committed fraud. Regardless, this   Owner/executive
               data indicates that the ability to defraud an                                       $700,000
               organization seems to be something people
               improve at with experience.                                              $470,000


                                                                          MEDIAN L OSS


               Perpetrator’s Department
                                                         Department*    Number of cases Percent of cases  Median loss
               Figure 31 is a heat map showing the   Operations              288          15%        $72,000
               frequency and median loss of fraud   Accounting               277          14%       $200,000
               schemes based on the perpetrator’s   Executive/upper management  234       12%       $596,000
                                                                                                     $94,000
               department. This illustrates the relative   Sales             225          11%        $86,000
                                                                                          9%
                                                                             175
                                                    Customer service
               risks of occupational fraud in the   Administrative support   116          6%         $76,000
               different parts of a typical organization,   Finance          101          5%        $100,000
               which may help anti-fraud profession-  Purchasing             96           5%        $200,000
               als effectively allocate anti-fraud con-  Information technology  69       3%        $200,000
               trols and resources. For example, the   Facilities and maintenance  60     3%        $100,000
                                                                                                     $85,000
               executive/upper management team      Warehousing/inventory    60           3%        $750,000
                                                    Board of directors
                                                                             45
                                                                                          2%
               and the accounting department were   Marketing/public relations  40        2%        $100,000
               both associated with high frequency   Manufacturing and production  35     2%        $275,000
               and median loss, which indicates that   Human resources       27           1%         $40,000
               fraud risks in these areas should be   Research and development  14        1%        $350,000
               carefully addressed in any anti-fraud   Legal                 13           1%        $195,000
               program.                               *Departments with fewer than 10 cases were omitted


    40    Perpetrators  Report to the Nations