
Page 275 - PPL-engelsk 2025
P. 275
Meteorology
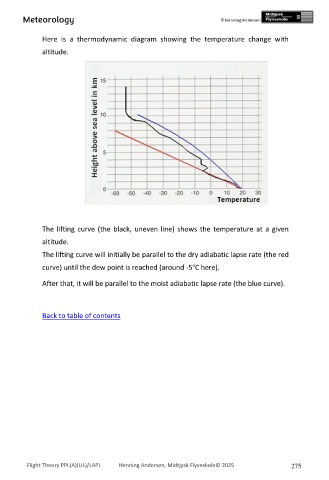
Here is a thermodynamic diagram showing the temperature change with
altitude.
The lifting curve (the black, uneven line) shows the temperature at a given
altitude.
The lifting curve will initially be parallel to the dry adiabatic lapse rate (the red
curve) until the dew point is reached (around -5°C here).
After that, it will be parallel to the moist adiabatic lapse rate (the blue curve).
Back to table of contents
Flight Theory PPL(A)(UL)/LAPL Henning Andersen, Midtjysk Flyveskole© 2025 275