
Page 79 - FlipBook BACK FROM SARAN - MAY 5 2020 - Don't Make Me Say I Told You So_6.14x9.21_v9_Neat
P. 79
Section 3
Stocks and Risk
While I believe that stocks will provide the growth you need for a
rising stream of income in retirement, there are risks to investing
in stocks. While the long-term trend of the stock market has
been positive, it has come with periods of significant volatility.
These declines can have a direct impact on the value of your
investments.
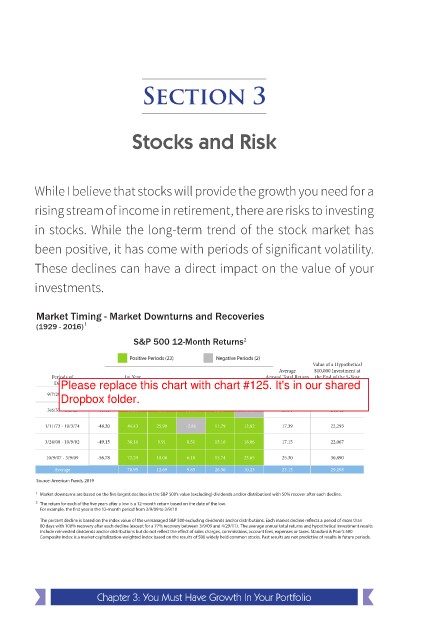
Market Timing - Market Downturns and Recoveries
(1929 - 2016) 1
S&P 500 12-Month Returns 2
Positive Periods (23) Negative Periods (2)
Value of a Hypothetical
Average $10,000 Investment at
Periods of 1st Year Annual Total Return the End of the 5-Year
Decline Decline 2nd Year 3rd Year 4th Year 5th Year for the 5-Year Period Period
Please replace this chart with chart #125. It's in our shared
9/7/29 - 6/1/32 -86.22% 137.60% 0.52% 6.42% 56.68% 16.52% 35.93% $46,401
Dropbox folder.
3/6/37 - 4/2/42 -60.01 64.26 8.96 31.08 32.19 -19.89 19.96 24,841
1/11/73 - 10/3/74 -48.20 44.43 25.99 -2.86 11.79 12.82 17.39 22,293
3/24/00 - 10/9/02 -49.15 36.16 9.91 8.51 15.16 18.06 17.15 22,067
10/9/07 - 3/9/09 -56.78 72.29 18.08 6.10 15.74 23.65 25.30 30,890
Average 70.95 12.69 9.85 26.30 10.23 23.15 29,298
Source: American Funds, 2019
1 Market downturns are based on the ve largest declines in the S&P 500’s value (excluding) dividends and/or distribution) with 50% recover after each decline.
2 The return for each of the ve years after a low is a 12-month return based on the date of the low.
For example, the rst year is the 12-month period from 3/9/09 to 3/9/10
The percent decline is based on the index value of the unmanaged S&P 500 excluding dividends and/or distributions. Each market decline re ects a period of more than
80 days with 100% recovery after each decline (except for a 77% recovery between 3/9/09 and 4/29/11). The average annual total returns and hypothetical investment results
include reinvested dividends and/or distributions but do not re ect the e ect of sales charges, commissions, account fees, expenses or taxes. Standard & Poor’s 500
Composite Index is a market capitalization-weighted index based on the results of 500 widely held common stocks. Past results are not predictive of results in future periods.
Chapter 3: You Must Have Growth In Your Portfolio