
Page 489 - Fluid, Electrolyte, and Acid-Base Disorders in Small Animal Practice
P. 489
Fluid, Electrolyte, and Acid-Base Disturbances in Liver Disease 477
30
Plasma lactate: d-Gal 25
Arterial plasma lactate (mmol/L ) 20 Venous plasma lactate (mmol/L) 15
25
Brain lactate: d-Gal
20
15
10
10
0 5 5
0
0.0 1.0 1.7 2.0
D-Galactosamine dose (g/kg) 0 5 10 15 20
Minutes of cardiac tamponade
Values represent 1 dog at each dose n = 5, mean +/–SD
A B
Arterial lactate
Portal lactate
8 7 6 Mixed venous lactate 20
Plasma lactate concentrations (mmol/L) 5 4 3 2 Arterial Lactate Concentrations (mmol/L) 15
10
0 1 5
0
0 8 16 24 32 40 48 56
0 1 3 4
Minutes of portal triad clamping Hours after hepatectomy
n = 6, mean +/–SD n = 6, mean +/–SD
C D
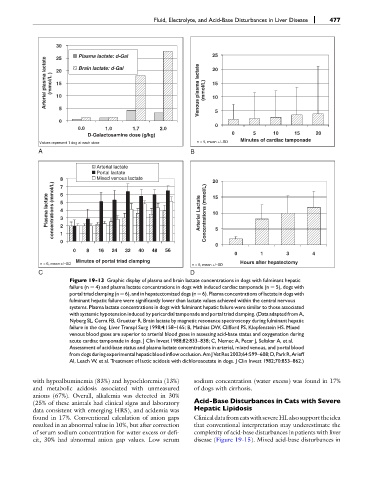
Figure 19-13 Graphic display of plasma and brain lactate concentrations in dogs with fulminant hepatic
failure (n ¼ 4) and plasma lactate concentrations in dogs with induced cardiac tamponade (n ¼ 5), dogs with
portal triad clamping (n ¼ 6), and in hepatectomized dogs (n ¼ 6). Plasma concentrations of lactate in dogs with
fulminant hepatic failure were significantly lower than lactate values achieved within the central nervous
systems. Plasma lactate concentrations in dogs with fulminant hepatic failure were similar to those associated
with systemic hypotension induced by pericardial tamponade and portal triad clamping. (Data adapted from A,
Nyberg SL, Cerra FB, Gruetter R. Brain lactate by magnetic resonance spectroscopy during fulminant hepatic
failure in the dog. Liver Transpl Surg 1998;4:158–165; B, Mathias DW, Clifford PS, Klopfenstein HS. Mixed
venous blood gases are superior to arterial blood gases in assessing acid-base status and oxygenation during
acute cardiac tamponade in dogs. J Clin Invest 1988;82:833–838; C, Nemec A, Pecar J, Seliskar A, et al.
Assessment of acid-base status and plasma lactate concentrations in arterial, mixed venous, and portal blood
fromdogsduringexperimentalhepaticbloodinflowocclusion.AmJVetRes2003;64:599–608;D,ParkR,Arieff
AI, Leach W, et al. Treatment of lactic acidosis with dichloroacetate in dogs. J Clin Invest 1982;70:853–862.)
with hypoalbuminemia (83%) and hypochloremia (13%) sodium concentration (water excess) was found in 17%
and metabolic acidosis associated with unmeasured of dogs with cirrhosis.
anions (67%). Overall, alkalemia was detected in 30%
(25% of these animals had clinical signs and laboratory Acid-Base Disturbances in Cats with Severe
data consistent with emerging HRS), and acidemia was Hepatic Lipidosis
found in 17%. Conventional calculation of anion gaps ClinicaldatafromcatswithsevereHLalsosupporttheidea
resulted in an abnormal value in 10%, but after correction that conventional interpretation may underestimate the
of serum sodium concentration for water excess or defi- complexity of acid-base disturbances in patients with liver
cit, 30% had abnormal anion gap values. Low serum disease (Figure 19-15). Mixed acid-base disturbances in