
Page 1420 - Veterinary Immunology, 10th Edition
P. 1420
VetBooks.ir
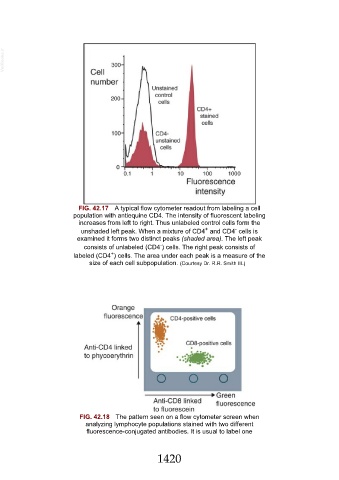
FIG. 42.17 A typical flow cytometer readout from labeling a cell
population with antiequine CD4. The intensity of fluorescent labeling
increases from left to right. Thus unlabeled control cells form the
+
-
unshaded left peak. When a mixture of CD4 and CD4 cells is
examined it forms two distinct peaks (shaded area). The left peak
-
consists of unlabeled (CD4 ) cells. The right peak consists of
+
labeled (CD4 ) cells. The area under each peak is a measure of the
size of each cell subpopulation. (Courtesy Dr. R.R. Smith III.)
FIG. 42.18 The pattern seen on a flow cytometer screen when
analyzing lymphocyte populations stained with two different
fluorescence-conjugated antibodies. It is usual to label one
1420