
Page 1445 - Veterinary Immunology, 10th Edition
P. 1445
VetBooks.ir
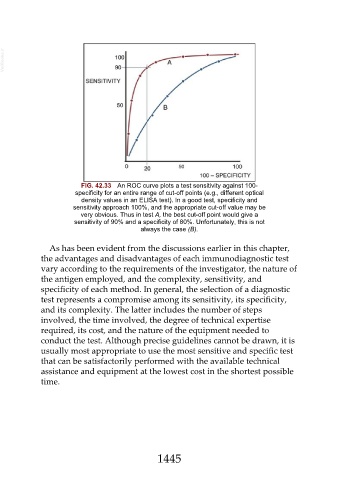
FIG. 42.33 An ROC curve plots a test sensitivity against 100-
specificity for an entire range of cut-off points (e.g., different optical
density values in an ELISA test). In a good test, specificity and
sensitivity approach 100%, and the appropriate cut-off value may be
very obvious. Thus in test A, the best cut-off point would give a
sensitivity of 90% and a specificity of 80%. Unfortunately, this is not
always the case (B).
As has been evident from the discussions earlier in this chapter,
the advantages and disadvantages of each immunodiagnostic test
vary according to the requirements of the investigator, the nature of
the antigen employed, and the complexity, sensitivity, and
specificity of each method. In general, the selection of a diagnostic
test represents a compromise among its sensitivity, its specificity,
and its complexity. The latter includes the number of steps
involved, the time involved, the degree of technical expertise
required, its cost, and the nature of the equipment needed to
conduct the test. Although precise guidelines cannot be drawn, it is
usually most appropriate to use the most sensitive and specific test
that can be satisfactorily performed with the available technical
assistance and equipment at the lowest cost in the shortest possible
time.
1445