
Page 248 - Natural Antioxidants, Applications in Foods of Animal Origin
P. 248
Methods and Their Applications for Measuring 227
VetBooks.ir
Raw Frozen! Thawed Pork 85% lean Sausage Colorimetry
PVC overwrapped styrofoam trays
40.00 .------------
Iii
....
0
.!: 35.00 -----T----------
~
~0
~ ~ 30.00 +--___: .. !'!!!!!!!!,;;;a;; ...... ~ .... ,..;:::---,
Ea::
·c u ~Control, w/o antiox.
-§ ~ 25.00 +-------------.3o~ - • Rosemary Extract
* u ....
::I
u 5l 20 00 +------------- ......... BHAIBHT
....
.
..r:::
~
~ 15.00 +---.,----,------,-----,
T=O 2 4 6 8
Weeks Stored in +5°F (-l5°C) to +l0°F (-l2°C) Freezer
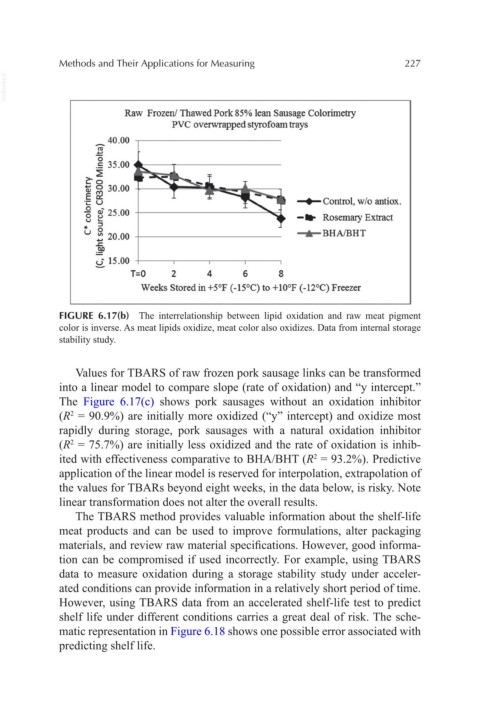
FIGURE 6.17(b) The interrelationship between lipid oxidation and raw meat pigment
color is inverse. As meat lipids oxidize, meat color also oxidizes. Data from internal storage
stability study.
Values for TBARS of raw frozen pork sausage links can be transformed
into a linear model to compare slope (rate of oxidation) and “y intercept.”
The Figure 6.17(c) shows pork sausages without an oxidation inhibitor
(R = 90.9%) are initially more oxidized (“y” intercept) and oxidize most
2
rapidly during storage, pork sausages with a natural oxidation inhibitor
(R = 75.7%) are initially less oxidized and the rate of oxidation is inhib-
2
ited with effectiveness comparative to BHA/BHT (R = 93.2%). Predictive
2
application of the linear model is reserved for interpolation, extrapolation of
the values for TBARs beyond eight weeks, in the data below, is risky. Note
linear transformation does not alter the overall results.
The TBARS method provides valuable information about the shelf-life
meat products and can be used to improve formulations, alter packaging
materials, and review raw material specifications. However, good informa-
tion can be compromised if used incorrectly. For example, using TBARS
data to measure oxidation during a storage stability study under acceler-
ated conditions can provide information in a relatively short period of time.
However, using TBARS data from an accelerated shelf-life test to predict
shelf life under different conditions carries a great deal of risk. The sche-
matic representation in Figure 6.18 shows one possible error associated with
predicting shelf life.