Page 249 - Natural Antioxidants, Applications in Foods of Animal Origin
P. 249

228                Natural Antioxidants: Applications in Foods of Animal Origin
  VetBooks.ir


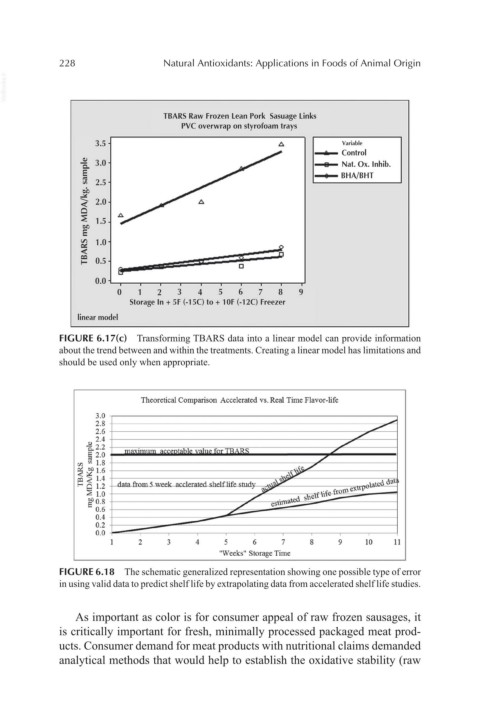
                               TBARS Raw Frozen Lean  Pork  Sasuage Links
                                  PVC overwrap on styrofoam trays
                   3.5                                          Variable
                                                           -- Control
                a.>
                c..   3.0                                  -    Nat. Ox. lnhib.
                E                                          -    BHA/BHT
                "'  "'   2.5
                --  2.0
                t>b
                ..:.:
                <(
                0
                ~  1.5
                100
                E
                Vl   1.0
                co:
                <(                           q
                CQ
                1-  0.5                      D
                       @=
                   0.0
                       0      2   3   4   5   6   7   8   9
                         Storage In  +SF (-15C) to+ 10F (-12C) Freezer
               linear model
            FIGURE 6.17(c)  Transforming TBARS data into a linear model can provide information
            about the trend between and within the treatments. Creating a linear model has limitations and
            should be used only when appropriate.


                           Theoretical Comparison  Accelerated vs. Real  Time Flavor-life
                   3.0
                   2.8                                               ...........
                   2.6                                            /
                 "  2.4                                         /
                 Q.2.2
                 p .o   maximum      valne tor  I"HARS        ./
               r/l  "'  1.8                            .·.le/   ./
               ~ 1 1.6                               .. ~
               ill  .((  1.4
                                                  •'~
               I- Q  1.2  -data.f~~cclerarecLshel!.JifP <Mlrl V   'IJ);Ji'   e\~
                                                            •  . fron> eJ<u y·
                 2  1.0                        ./     ated  sne\thf--
                 ~0.8                              e
                                            ./
                 "0.6             --      ---
                   0.4
                   0.2
                   0.0
                          2          4         6     7    8    9    10    ll
                                         "Weeks" Storage Time
            FIGURE 6.18  The schematic generalized representation showing one possible type of error
            in using valid data to predict shelf life by extrapolating data from accelerated shelf life studies.
               As important as color is for consumer appeal of raw frozen sausages, it
            is critically important for fresh, minimally processed packaged meat prod-
            ucts. Consumer demand for meat products with nutritional claims demanded
            analytical methods that would help to establish the oxidative stability (raw
   244   245   246   247   248   249   250   251   252   253   254