
Page 257 - Natural Antioxidants, Applications in Foods of Animal Origin
P. 257
236 Natural Antioxidants: Applications in Foods of Animal Origin
VetBooks.ir
+
+
IT = (C14:0 C16:0 C18:0) ω− 3 PUFA (6.11)
×
+
(0.5 MUFA) (0.5 ω− 6 PUFA) (3 ω− 3 PUFA)
×
+
+
×
ω− 6 PUFA
+
+
×
(4 C14 : 0) (C16 : 0 C18: 0)
=
A (6.12)
Σ MUFA PUFA ω− 6 PUFA ω− 3
Σ
Σ
+
+
+
DFA desirable fatty acids ∑ (PUFA C18: 0)
= = (6.13)
OFA undesirable fatty acids ∑ (SFA C18: 0)
−
PUFA ω− 3
(6.14)
ω− 6 PUFA
where C:14, C:16, C:18 are carbon notations for the fatty acids,
PUFA is polyunsaturated fatty acids,
MUFA is monounsaturated fatty acids,
SAT is saturated fatty acids.
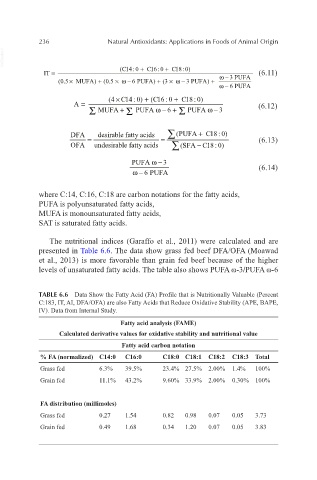
The nutritional indices (Garaffo et al., 2011) were calculated and are
presented in Table 6.6. The data show grass fed beef DFA/OFA (Moawad
et al., 2013) is more favorable than grain fed beef because of the higher
levels of unsaturated fatty acids. The table also shows PUFA ω-3/PUFA ω-6
TABLE 6.6 Data Show the Fatty Acid (FA) Profile that is Nutritionally Valuable (Percent
C:183, IT, AI, DFA/OFA) are also Fatty Acids that Reduce Oxidative Stability (APE, BAPE,
IV). Data from Internal Study.
Fatty acid analysis (FAME)
Calculated derivative values for oxidative stability and nutritional value
Fatty acid carbon notation
% FA (normalized) C14:0 C16:0 C18:0 C18:1 C18:2 C18:3 Total
Grass fed 6.3% 39.5% 23.4% 27.5% 2.00% 1.4% 100%
Grain fed 11.1% 43.2% 9.60% 33.9% 2.00% 0.30% 100%
FA distribution (millimoles)
Grass fed 0.27 1.54 0.82 0.98 0.07 0.05 3.73
Grain fed 0.49 1.68 0.34 1.20 0.07 0.05 3.83