Page 276 - Natural Antioxidants, Applications in Foods of Animal Origin
P. 276

Methods and Their Applications for Measuring                   255
  VetBooks.ir  6.5 ATTACHMENTS


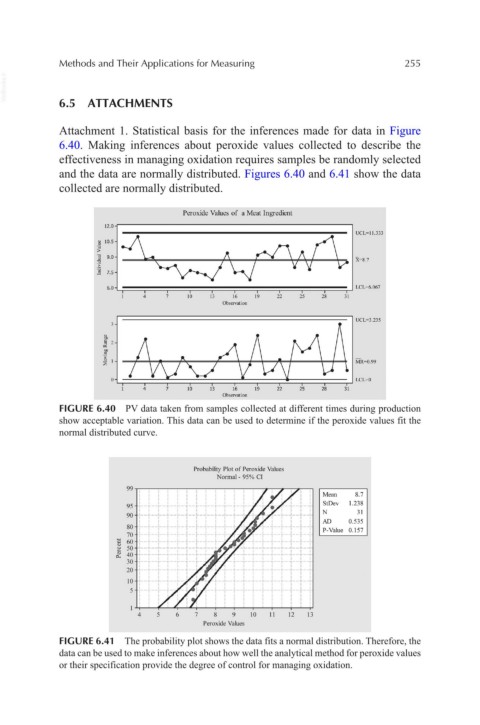
            Attachment 1. Statistical basis for the inferences made for data in Figure
            6.40.  Making  inferences  about  peroxide  values  collected  to  describe  the
            effectiveness in managing oxidation requires samples be randomly selected
            and the data are normally distributed. Figures 6.40 and 6.41 show the data
            collected are normally distributed.

                                   Peroxide Values of  a Meat Ingredient
                    12.0-r------------------------------,
                                                           ~
                    10.5   -  ;\
                     9.0   ::\.           !)    c£\ /\  I  \
                                           \:j
                     7.5      ~ ""'                            p

                                   10   13   16   19   22   25   28   31
                                          ObseiVation
                      !-===========================! UCL~3.235


                                   10   13   16   19   22   25   28   31
                                          Observation
            FIGURE 6.40  PV data taken from samples collected at different times during production
            show acceptable variation. This data can be used to determine if the peroxide values fit the
            normal distributed curve.


                                     Probabitity Plot of Peroxide Values
                                         Normal - 95% CI
                                   ,
                                         ,
                                              !
                                     ,
                                  ,
                        99~~~~,~~~~-,~-~~-~-~~~~~~~       ~   Mean   8.7
                                          ,
                                            ,
                                                        ,
                                                      :
                            ,
                              ,
                                                 ~
                                                   .
                           ,
                                                            StDev   1.238
                        :~ rt==~=t==~=i==t=4==t=~==t==~~:~-r.-r~~t=i==t=~:   N   31
                        so  ~--t--:--t--r--t--r-1--+--1--+· -:-  -r--t--t--1--t--:   AD   0.535
                        70  --+--:--+--t-i--t-1--+--i-- r- -~ T--t-i--t-4--+--l-  P- Value  0.157
                           1
                      ~ ~ lti~U~l~~!=:=~;:fifl~~l~t~l~ttl
                          rrT-r-~--·  :-r-rT-rT-rT_r_r_T-rT
                                               10   11   12   13
                                      Peroxide Values
            FIGURE 6.41  The probability plot shows the data fits a normal distribution. Therefore, the
            data can be used to make inferences about how well the analytical method for peroxide values
            or their specification provide the degree of control for managing oxidation.
   271   272   273   274   275   276   277   278   279   280   281