
Page 166 - Small Animal Clinical Nutrition 5th Edition
P. 166
168 Small Animal Clinical Nutrition
Assuming consumption is stable after Day 3, the data col-
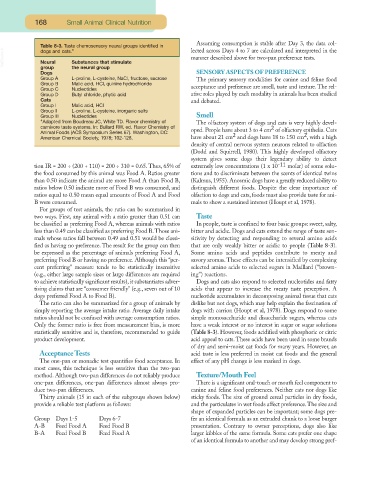
Table 8-3. Taste chemosensory neural groups identified in lected across Days 4 to 7 are calculated and interpreted in the
VetBooks.ir Neural Substances that stimulate manner described above for two-pan preference tests.
dogs and cats.*
group
Dogs the neural group SENSORY ASPECTS OF PREFERENCE
Group A L-proline, L-cysteine, NaCl, fructose, sucrose The primary sensory modalities for canine and feline food
Group B Malic acid, HCl, quinine hydrochloride
Group C Nucleotides acceptance and preference are smell, taste and texture. The rel-
Group D Butyl chloride, phytic acid ative roles played by each modality in animals has been studied
Cats and debated.
Group I Malic acid, HCl
Group II L-proline, L-cysteine, inorganic salts
Group III Nucleotides Smell
*Adapted from Boudreau JC, White TD. Flavor chemistry of The olfactory system of dogs and cats is very highly devel-
carnivore taste systems. In: Bullard RW, ed. Flavor Chemistry of 2
Animal Foods (ACS Symposium Series 67). Washington, DC: oped. People have about 3 to 4 cm of olfactory epithelia. Cats
2
2
American Chemical Society, 1978; 102-128. have about 21 cm and dogs have 18 to 150 cm , with a high
density of central nervous system neurons related to olfaction
(Dodd and Squirrell, 1980). This highly developed olfactory
system gives some dogs their legendary ability to detect
tion IR = 200 ÷ (200 + 110) = 200 ÷ 310 = 0.65. Thus, 65% of extremely low concentrations (1 x 10 -11 molar) of some solu-
the food consumed by this animal was Food A. Ratios greater tions and to discriminate between the scents of identical twins
than 0.50 indicate the animal ate more Food A than Food B, (Kalmus, 1955). Anosmic dogs have a greatly reduced ability to
ratios below 0.50 indicate more of Food B was consumed, and distinguish different foods. Despite the clear importance of
ratios equal to 0.50 mean equal amounts of Food A and Food olfaction to dogs and cats, foods must also provide taste for ani-
B were consumed. mals to show a sustained interest (Houpt et al, 1978).
For groups of test animals, the ratio can be summarized in
two ways. First, any animal with a ratio greater than 0.51 can Taste
be classified as preferring Food A, whereas animals with ratios In people, taste is confined to four basic groups: sweet, salty,
less than 0.49 can be classified as preferring Food B.Those ani- bitter and acidic. Dogs and cats extend the range of taste sen-
mals whose ratios fall between 0.49 and 0.51 would be classi- sitivity by detecting and responding to several amino acids
fied as having no preference. The result for the group can then that are only weakly bitter or acidic to people (Table 8-3).
be expressed as the percentage of animals preferring Food A, Some amino acids and peptides contribute to meaty and
preferring Food B or having no preference. Although this “per- savory aromas.These effects can be intensified by complexing
cent preferring” measure tends to be statistically insensitive selected amino acids to selected sugars in Maillard (“brown-
(e.g., either large sample sizes or large differences are required ing”) reactions.
to achieve statistically significant results), it substantiates adver- Dogs and cats also respond to selected nucleotides and fatty
tising claims that are “consumer friendly” (e.g., seven out of 10 acids that appear to increase the meaty taste perception. A
dogs preferred Food A to Food B). nucleotide accumulates in decomposing animal tissue that cats
The ratio can also be summarized for a group of animals by dislike but not dogs, which may help explain the fascination of
simply reporting the average intake ratio. Average daily intake dogs with carrion (Houpt et al, 1978). Dogs respond to some
ratios should not be confused with average consumption ratios. simple monosaccharide and disaccharide sugars, whereas cats
Only the former ratio is free from measurement bias, is more have a weak interest or no interest in sugar or sugar solutions
statistically sensitive and is, therefore, recommended to guide (Table 8-3). However, foods acidified with phosphoric or citric
product development. acid appeal to cats. These acids have been used in some brands
of dry and semi-moist cat foods for many years. However, an
Acceptance Tests acid taste is less preferred in moist cat foods and the general
The one-pan or monadic test quantifies food acceptance. In effect of any pH change is less marked in dogs.
most cases, this technique is less sensitive than the two-pan
method. Although two-pan differences do not reliably produce Texture/Mouth Feel
one-pan differences, one-pan differences almost always pro- There is a significant oral-touch or mouth feel component to
duce two-pan differences. canine and feline food preferences. Neither cats nor dogs like
Thirty animals (15 in each of the subgroups shown below) sticky foods. The size of ground cereal particles in dry foods,
provide a reliable test platform as follows: and the particulates in wet foods affect preference.The size and
shape of expanded particles can be important; some dogs pre-
Group Days 1-5 Days 6-7 fer an identical formula as an extruded chunk to a loose burger
A-B Feed Food A Feed Food B presentation. Contrary to owner perceptions, dogs also like
B-A Feed Food B Feed Food A larger kibbles of the same formula. Some cats prefer one shape
of an identical formula to another and may develop strong pref-