
Page 170 - Small Animal Clinical Nutrition 5th Edition
P. 170
172 Small Animal Clinical Nutrition
Box 8-4. True Cost of Feeding.
VetBooks.ir
Pet owners usually compare the cost of pet foods on the price
per unit (price per bag or price per can) rather than the true cost
of feeding (cost per day or cost per year). It is easy to compare
the price per unit when evaluating two different pet foods, but
more difficult to compare the true cost of feeding. The following
example demonstrates that veterinarians and their health care
team need to discuss the true cost of feeding with pet owners
when clients are concerned about the price of a particular food.
MOIST CAT FOOD
A 5-kg, three-year-old neutered male cat is diagnosed with lower
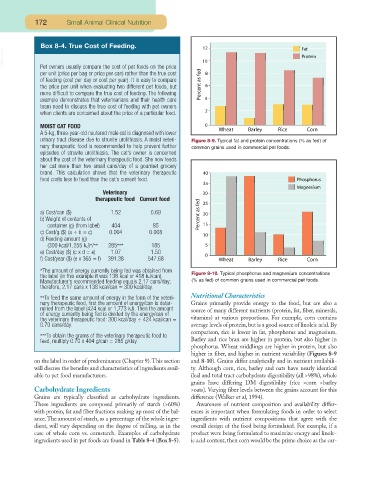
urinary tract disease due to struvite urolithiasis. A moist veteri- Figure 8-9. Typical fat and protein concentrations (% as fed) of
nary therapeutic food is recommended to help prevent further common grains used in commercial pet foods.
episodes of struvite urolithiasis. The cat’s owner is concerned
about the cost of the veterinary therapeutic food. She now feeds
her cat more than two small cans/day of a gourmet grocery
brand. This calculation shows that the veterinary therapeutic
food costs less to feed than the cat’s current food.
Veterinary
therapeutic food Current food
a) Cost/can ($) 1.52 0.69
b) Weight of contents of
container (g) (from label) 404 85
c) Cost/g ($) (a ÷ b = c) 0.004 0.008
d) Feeding amount (g)
(300 kcal/1,255 kJ)*/** 285*** 185
e) Cost/day ($) (c x d = e) 1.07 1.50
f) Cost/year ($) (e x 365 = f) 391.38 547.68
*The amount of energy currently being fed was obtained from Figure 8-10. Typical phosphorus and magnesium concentrations
the label (in this example it was 138 kcal or 418 kJ/can).
Manufacturer’s recommended feeding equals 2.17 cans/day; (% as fed) of common grains used in commercial pet foods.
therefore, 2.17 cans x 138 kcal/can = 300 kcal/day.
**To feed the same amount of energy in the form of the veteri- Nutritional Characteristics
nary therapeutic food, first the amount of energy/can is deter- Grains primarily provide energy to the food, but are also a
mined from the label (424 kcal or 1,773 kJ). Then the amount source of many different nutrients (protein, fat, fiber, minerals,
of energy currently being fed is divided by the energy/can of
the veterinary therapeutic food: 300 kcal/day ÷ 424 kcal/can = vitamins) at various proportions. For example, corn contains
0.70 cans/day. average levels of protein, but is a good source of linoleic acid. By
comparison, rice is lower in fat, phosphorus and magnesium.
***To obtain the grams of the veterinary therapeutic food to
feed, multiply 0.70 x 404 g/can = 285 g/day. Barley and rice bran are higher in protein, but also higher in
phosphorus. Wheat middlings are higher in protein, but also
higher in fiber, and higher in nutrient variability (Figures 8-9
on the label in order of predominance (Chapter 9).This section and 8-10). Grains differ analytically and in nutrient availabili-
will discuss the benefits and characteristics of ingredients avail- ty. Although corn, rice, barley and oats have nearly identical
able to pet food manufacturers. ileal and total tract carbohydrate digestibility (all >98%), whole
grains have differing DM digestibility (rice >corn >barley
Carbohydrate Ingredients >oats). Varying fiber levels between the grains account for this
Grains are typically classified as carbohydrate ingredients. difference (Walker et al, 1994).
These ingredients are composed primarily of starch (>60%) Awareness of nutrient composition and availability differ-
with protein, fat and fiber fractions making up most of the bal- ences is important when formulating foods in order to select
ance.The amount of starch, as a percentage of the whole ingre- ingredients with nutrient compositions that agree with the
dient, will vary depending on the degree of milling, as in the overall design of the food being formulated. For example, if a
case of whole corn vs. cornstarch. Examples of carbohydrate product were being formulated to maximize energy and linole-
ingredients used in pet foods are found in Table 8-4 (Box 8-5). ic acid content, then corn would be the prime choice as the car-