Page 12 - Ecobank Gambia Annual Report 2020
P. 12

Financial Statements & Annual Report
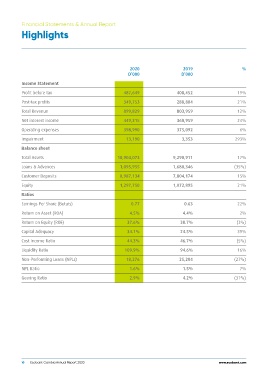
Highlights

	                                      2020 	   2019 	            %
	                                     D’000 	  D’000
Income Statement                                               19%
Profit before tax	                    487,649	408,452	         21%
Post-tax profits	                     349,753	288,804	         12%
Total Revenue	                        899,829	803,959	         24%
Net interest income	                  449,315	360,959	
Operating expenses	                   398,990	375,092	          6%
Impairment	                                                  293%
Balance sheet                          13,190	3,353	
Total Assets	                                                  17%
Loans & Advances	                     10,904,073	9,290,911	  (35%)
Customer Deposits	                     1,095,955	1,680,346	
Equity	                                8,987,134	7,804,174	    15%
Ratios                                 1,297,750	1,072,895	    21%
Earnings Per Share (Bututs)	
Return on Asset (ROA)	                    0.77	0.63	           22%
Return on Equity (ROE)	                  4.5%	4.4%	             2%
Capital Adequacy	                      37.6%	38.7%	
Cost Income Ratio	                     34.1%	24.5%	           (3%)
Liquidity Ratio	                       44.3%	46.7%	            39%
Non-Performing Loans (NPLs)	          109.9%	94.6%	           (5%)
NPL Ratio	                            18,276	25,204	           16%
Gearing Ratio	                           1.6%	1.5%	          (27%)
                                         2.9%	4.2%	
                                                                7%
                                                             (31%)

10 Ecobank Gambia Annual Report 2020                         www.ecobank.com
   7   8   9   10   11   12   13   14   15   16   17