Page 264 - CEO Orientation
P. 264

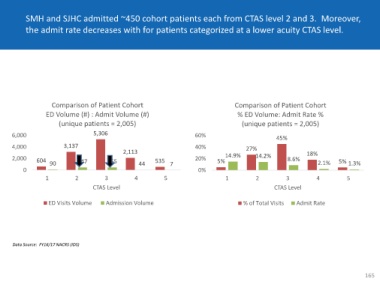
SMH and SJHC admitted ~450 cohort patients each from CTAS level 2 and 3.  Moreover,

           the admit rate decreases with for patients categorized at a lower acuity CTAS level.


                     Comparison of Patient Cohort                                         Comparison of Patient Cohort
                  ED Volume (#) : Admit Volume (#)                                         % ED Volume: Admit Rate %
                       (unique patients = 2,005)                                             (unique patients = 2,005)

      6,000                         5,306                                  60%
                                                                                                          45%
      4,000              3,137                                             40%                27%
                                                2,113                                                                18%
      2,000    604                                                         20%        14.9%       14.2%       8.6%
                    90        447         455         44    535  7                 5%                                    2.1%    5%  1.3%
          0                                                                 0%
                  1           2          3          4          5                      1           2           3          4           5
                                    CTAS Level                                                           CTAS Level

                   ED Visits Volume      Admission Volume                                    % of Total Visits   Admit Rate


      Data Source:  FY16/17 NACRS (IDS)


                                                                                                                                           165
   259   260   261   262   263   264   265   266   267   268   269