
Page 223 - Six Sigma Advanced Tools for Black Belts and Master Black Belts
P. 223
August 31, 2006
Char Count= 0
2:58
JWBK119-13
208 A Graphical Approach to Obtaining Confidence Limits of C pk
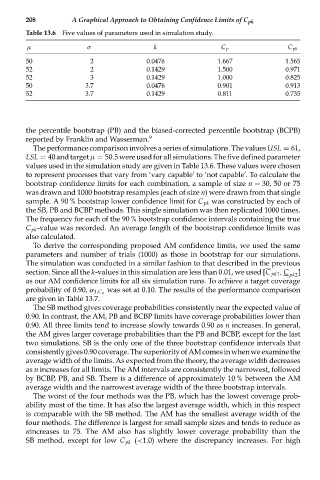
Table 13.6 Five values of parameters used in simulation study.
μ σ k C p C pk
50 2 0.0476 1.667 1.565
52 2 0.1429 1.500 0.971
52 3 0.1429 1.000 0.825
50 3.7 0.0476 0.901 0.913
52 3.7 0.1429 0.811 0.735
the percentile bootstrap (PB) and the biased-corrected percentile bootstrap (BCPB)
reported by Franklin and Wasserman. 9
The performance comparison involves a series of simulations. The values USL = 61,
LSL = 40 and target μ = 50.5 were used for all simulations. The five defined parameter
values used in the simulation study are given in Table 13.6. These values were chosen
to represent processes that vary from ‘vary capable’ to ‘not capable’. To calculate the
bootstrap confidence limits for each combination, a sample of size n = 30, 50 or 75
was drawn and 1000 bootstrap resamples (each of size n) were drawn from that single
sample. A 90 % bootstrap lower confidence limit for C pk was constructed by each of
the SB, PB and BCBP methods. This single simulation was then replicated 1000 times.
The frequency for each of the 90 % bootstrap confidence intervals containing the true
C pk -value was recorded. An average length of the bootstrap confidence limits was
also calculated.
To derive the corresponding proposed AM confidence limits, we used the same
parameters and number of trials (1000) as those in bootstrap for our simulations.
The simulation was conducted in a similar fashion to that described in the previous
section. Since all the k-values in this simulation are less than 0.01, we used [C pk1 , C pk2 ]
as our AM confidence limits for all six simulation runs. To achieve a target coverage
was set at 0.10. The results of the performance comparison
probability of 0.90, α 1,C p
are given in Table 13.7.
The SB method gives coverage probabilities consistently near the expected value of
0.90. In contrast, the AM, PB and BCBP limits have coverage probabilities lower than
0.90. All three limits tend to increase slowly towards 0.90 as n increases. In general,
the AM gives larger coverage probabilities than the PB and BCBP, except for the last
two simulations. SB is the only one of the three bootstrap confidence intervals that
consistentlygives0.90coverage.ThesuperiorityofAMcomesinwhenweexaminethe
average width of the limits. As expected from the theory, the average width decreases
as n increases for all limits. The AM intervals are consistently the narrowest, followed
by BCBP, PB, and SB. There is a difference of approximately 10 % between the AM
average width and the narrowest average width of the three bootstrap intervals.
The worst of the four methods was the PB, which has the lowest coverage prob-
ability most of the time. It has also the largest average width, which in this respect
is comparable with the SB method. The AM has the smallest average width of the
four methods. The difference is largest for small sample sizes and tends to reduce as
nincreases to 75. The AM also has slightly lower coverage probability than the
SB method, except for low C pk (<1.0) where the discrepancy increases. For high