
Page 220 - Six Sigma Advanced Tools for Black Belts and Master Black Belts
P. 220
2:58
Char Count= 0
August 31, 2006
JWBK119-13
A Simulation Study 205
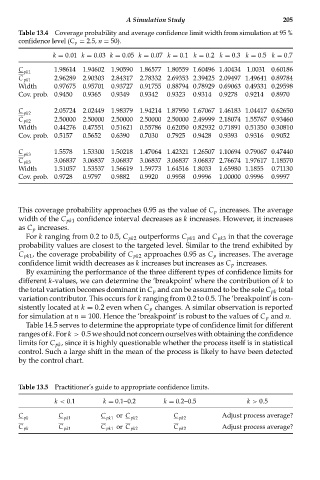
Table 13.4 Coverage probability and average confidence limit width from simulation at 95 %
confidence level (C p = 2.5, n = 50).
k = 0.01 k = 0.03 k = 0.05 k = 0.07 k = 0.1 k = 0.2 k = 0.3 k = 0.5 k = 0.7
C pk1 1.98614 1.94602 1.90590 1.86577 1.80559 1.60496 1.40434 1.0031 0.60186
C pk1 2.96289 2.90303 2.84317 2.78332 2.69353 2.39425 2.09497 1.49641 0.89784
Width 0.97675 0.95701 0.93727 0.91755 0.88794 0.78929 0.69063 0.49331 0.29598
Cov. prob. 0.9450 0.9365 0.9349 0.9342 0.9323 0.9314 0.9278 0.9214 0.8970
C 2.05724 2.02449 1.98379 1.94214 1.87950 1.67067 1.46183 1.04417 0.62650
pk2
2.50000 2.50000 2.50000 2.50000 2.50000 2.49999 2.18074 1.55767 0.93460
C pk2
Width 0.44276 0.47551 0.51621 0.55786 0.62050 0.82932 0.71891 0.51350 0.30810
Cov. prob. 0.5157 0.5652 0.6390 0.7030 0.7925 0.9428 0.9393 0.9316 0.9052
C pk3 1.5578 1.53300 1.50218 1.47064 1.42321 1.26507 1.10694 0.79067 0.47440
C pk3 3.06837 3.06837 3.06837 3.06837 3.06837 3.06837 2.76674 1.97617 1.18570
Width 1.51057 1.53537 1.56619 1.59773 1.64516 1.8033 1.65980 1.1855 0.71130
Cov. prob. 0.9728 0.9797 0.9882 0.9920 0.9958 0.9996 1.00000 0.9996 0.9997
This coverage probability approaches 0.95 as the value of C p increases. The average
width of the C pk1 confidence interval decreases as k increases. However, it increases
as C p increases.
For k ranging from 0.2 to 0.5, C pk2 outperforms C pk1 and C pk3 in that the coverage
probability values are closest to the targeted level. Similar to the trend exhibited by
C pk1 , the coverage probability of C pk2 approaches 0.95 as C p increases. The average
confidence limit width decreases as k increases but increases as C p increases.
By examining the performance of the three different types of confidence limits for
different k-values, we can determine the ‘breakpoint’ where the contribution of k to
the total variation becomes dominant in C p and can be assumed to be the sole C pk total
variation contributor. This occurs for k ranging from 0.2 to 0.5. The ‘breakpoint’is con-
sistently located at k = 0.2 even when C p changes. A similar observation is reported
for simulation at n = 100. Hence the ‘breakpoint’ is robust to the values of C p and n.
Table 14.5 serves to determine the appropriate type of confidence limit for different
ranges of k. For k > 0.5 we should not concern ourselves with obtaining the confidence
limits for C pk , since it is highly questionable whether the process itself is in statistical
control. Such a large shift in the mean of the process is likely to have been detected
by the control chart.
Table 13.5 Practitioner’s guide to appropriate confidence limits.
k < 0.1 k = 0.1--0.2 k = 0.2--0.5 k > 0.5
C pk C pk1 C pk1 or C pk2 C pk2 Adjust process average?
Adjust process average?
C pk C pk1 C pk1 or C pk2 C pk2