
Page 216 - Six Sigma Advanced Tools for Black Belts and Master Black Belts
P. 216
August 31, 2006
2:58
Char Count= 0
JWBK119-13
201
Confidence Limits For C pk
(C , k, p)
p
k
(C , k, p)
p
C p
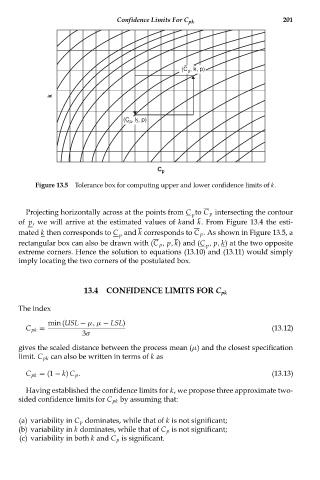
Figure 13.5 Tolerance box for computing upper and lower confidence limits of k.
Projecting horizontally across at the points from C to C p intersecting the contour
p
¯
of p, we will arrive at the estimated values of kand k. From Figure 13.4 the esti-
mated k then corresponds to C and k corresponds to C p . As shown in Figure 13.5, a
p
rectangular box can also be drawn with (C p , p, k) and (C , p, k) at the two opposite
p
extreme corners. Hence the solution to equations (13.10) and (13.11) would simply
imply locating the two corners of the postulated box.
13.4 CONFIDENCE LIMITS FOR C pk
The index
min (USL − μ, μ − LSL)
C pk = (13.12)
3σ
gives the scaled distance between the process mean (μ) and the closest specification
limit. C pk can also be written in terms of k as
C pk = (1 − k) C p . (13.13)
Having established the confidence limits for k, we propose three approximate two-
sided confidence limits for C pk by assuming that:
(a) variability in C p dominates, while that of k is not significant;
(b) variability in k dominates, while that of C p is not significant;
(c) variability in both k and C p is significant.