
Page 286 - Six Sigma Advanced Tools for Black Belts and Master Black Belts
P. 286
OTE/SPH
OTE/SPH
Char Count= 0
3:6
August 31, 2006
JWBK119-18
Stages in Statistical Applications 271
P
x 1
x 2 y I
y II
x k
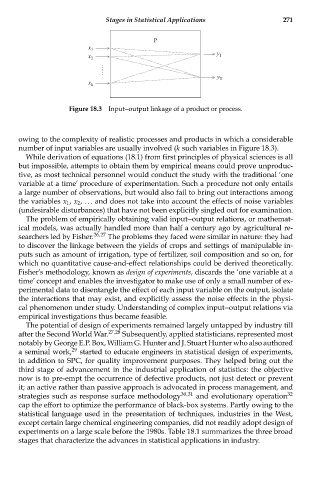
Figure 18.3 Input--output linkage of a product or process.
owing to the complexity of realistic processes and products in which a considerable
number of input variables are usually involved (k such variables in Figure 18.3).
While derivation of equations (18.1) from first principles of physical sciences is all
but impossible, attempts to obtain them by empirical means could prove unproduc-
tive, as most technical personnel would conduct the study with the traditional ‘one
variable at a time’ procedure of experimentation. Such a procedure not only entails
a large number of observations, but would also fail to bring out interactions among
the variables x 1 , x 2 , . . . and does not take into account the effects of noise variables
(undesirable disturbances) that have not been explicitly singled out for examination.
The problem of empirically obtaining valid input--output relations, or mathemat-
ical models, was actually handled more than half a century ago by agricultural re-
searchers led by Fisher. 26,27 The problems they faced were similar in nature: they had
to discover the linkage between the yields of crops and settings of manipulable in-
puts such as amount of irrigation, type of fertilizer, soil composition and so on, for
which no quantitative cause-and-effect relationships could be derived theoretically.
Fisher’s methodology, known as design of experiments, discards the ‘one variable at a
time’ concept and enables the investigator to make use of only a small number of ex-
perimental data to disentangle the effect of each input variable on the output, isolate
the interactions that may exist, and explicitly assess the noise effects in the physi-
cal phenomenon under study. Understanding of complex input--output relations via
empirical investigations thus became feasible.
The potential of design of experiments remained largely untapped by industry till
after the Second World War. 27,28 Subsequently, applied statisticians, represented most
notably by George E.P. Box, William G. Hunter and J. Stuart Hunter who also authored
a seminal work, 29 started to educate engineers in statistical design of experiments,
in addition to SPC, for quality improvement purposes. They helped bring out the
third stage of advancement in the industrial application of statistics: the objective
now is to pre-empt the occurrence of defective products, not just detect or prevent
it; an active rather than passive approach is advocated in process management, and
strategies such as response surface methodology 30,31 and evolutionary operation 32
cap the effort to optimize the performance of black-box systems. Partly owing to the
statistical language used in the presentation of techniques, industries in the West,
except certain large chemical engineering companies, did not readily adopt design of
experiments on a large scale before the 1980s. Table 18.1 summarizes the three broad
stages that characterize the advances in statistical applications in industry.