
Page 289 - Six Sigma Advanced Tools for Black Belts and Master Black Belts
P. 289
OTE/SPH
OTE/SPH
August 31, 2006
JWBK119-18
Taguchi Methods
274 3:6 Char Count= 0
x y y = f (x)
P
Inputs Outputs Systems
Independent variables Dependent variables Mathematics
Factors Responses Statistics
Causes Quality Quality Assurance
Parameters Performance Indices Control
Key control characteristics Key process characteristics Engineering
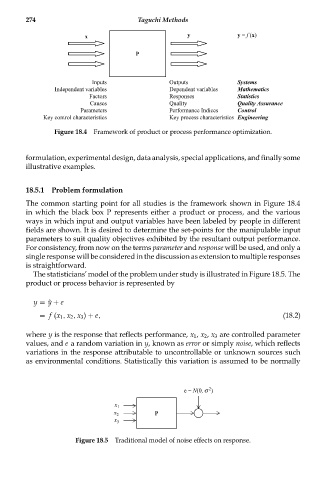
Figure 18.4 Framework of product or process performance optimization.
formulation,experimentaldesign,dataanalysis,specialapplications,andfinallysome
illustrative examples.
18.5.1 Problem formulation
The common starting point for all studies is the framework shown in Figure 18.4
in which the black box P represents either a product or process, and the various
ways in which input and output variables have been labeled by people in different
fields are shown. It is desired to determine the set-points for the manipulable input
parameters to suit quality objectives exhibited by the resultant output performance.
For consistency, from now on the terms parameter and response will be used, and only a
single response will be considered in the discussion as extension to multiple responses
is straightforward.
The statisticians’model of the problem under study is illustrated in Figure 18.5. The
product or process behavior is represented by
y = ˆy + e
= f (x 1 , x 2 , x 3 ) + e, (18.2)
where y is the response that reflects performance, x 1 , x 2 , x 3 are controlled parameter
values, and e a random variation in y, known as error or simply noise, which reflects
variations in the response attributable to uncontrollable or unknown sources such
as environmental conditions. Statistically this variation is assumed to be normally
2
e ~ N(0, s )
x 1
x 2 P
x 3
Figure 18.5 Traditional model of noise effects on response.