
Page 305 - Six Sigma Advanced Tools for Black Belts and Master Black Belts
P. 305
OTE/SPH
OTE/SPH
August 31, 2006
JWBK119-18
Taguchi Methods
290 3:6 Char Count= 0
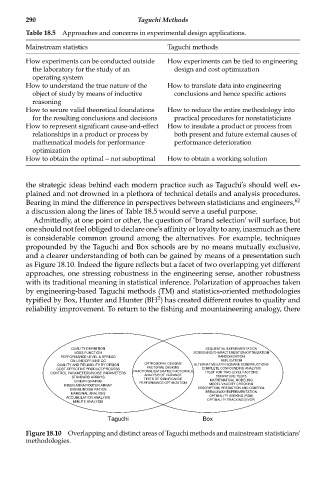
Table 18.5 Approaches and concerns in experimental design applications.
Mainstream statistics Taguchi methods
How experiments can be conducted outside How experiments can be tied to engineering
the laboratory for the study of an design and cost optimization
operating system
How to understand the true nature of the How to translate data into engineering
object of study by means of inductive conclusions and hence specific actions
reasoning
How to secure valid theoretical foundations How to reduce the entire methodology into
for the resulting conclusions and decisions practical procedures for nonstatisticians
How to represent significant cause-and-effect How to insulate a product or process from
relationships in a product or process by both present and future external causes of
mathematical models for performance performance deterioration
optimization
How to obtain the optimal -- not suboptimal How to obtain a working solution
the strategic ideas behind each modern practice such as Taguchi’s should well ex-
plained and not drowned in a plethora of technical details and analysis procedures.
Bearing in mind the difference in perspectives between statisticians and engineers, 62
a discussion along the lines of Table 18.5 would serve a useful purpose.
Admittedly, at one point or other, the question of ‘brand selection’ will surface, but
one should not feel obliged to declare one’s affinity or loyalty to any, inasmuch as there
is considerable common ground among the alternatives. For example, techniques
propounded by the Taguchi and Box schools are by no means mutually exclusive,
and a clearer understanding of both can be gained by means of a presentation such
as Figure 18.10. Indeed the figure reflects but a facet of two overlapping yet different
approaches, one stressing robustness in the engineering sense, another robustness
with its traditional meaning in statistical inference. Polarization of approaches taken
by engineering-based Taguchi methods (TM) and statistics-oriented methodologies
2
typified by Box, Hunter and Hunter (BH ) has created different routes to quality and
reliability improvement. To return to the fishing and mountaineering analogy, there
QUALITY DEFINITION SEQUENTIAL EXPERIMENTATION
LOSS FUNCTION SCREENING/CHARACTERIZATION/OPTIMIZATION
PERFORMANCE LEVEL & SPREAD RANDOMIZATION
ON-LINE/OFF-LINE QC REPLICATION
QUALITY AND RELIABILITY BY DESIGN ORTHOGONAL DESIGNS ALTERNATIVE LATIN SQUARE CONSTRUCTIONS
COST-EFFECTIVE PRODUCT/PROCESS FACTORIAL DESIGNS COMPLETE CONFOUNDING ANALYSIS
CONTROL PARAMETERS/NOISE PARAMETERS FRACTIONAL/SATURATED FACTORIALS t TEST FOR TWO-LEVEL FACTORS
ANALYSIS OF VARIANCE
STANDARD ARRAYS TESTS OF SIGNIFICANCE CURVATURE TESTS
LINEAR GRAPHS MATHEMATICAL MODELING
INNER ARRAY/OUTER ARRAY PERFORMANCE OPTIMIZATION MODEL VALIDITY CHECKING
SIGNAL/NOISE RATIOS DESCRIPTION, PREDICTION AND CONTROL
MARGINAL ANALYSIS BREAKAWAY EXPERIMENTATION
OPTIMALITY SEEKING (RSM)
ACCUMULATION ANALYSIS OPTIMALITY TRACKING (EVOP)
MINUTE ANALYSIS
Taguchi Box
Figure 18.10 Overlapping and distinct areas of Taguchi methods and mainstream statisticians’
methodologies.