
Page 409 - Six Sigma Advanced Tools for Black Belts and Master Black Belts
P. 409
OTE/SPH
OTE/SPH
3:9
August 31, 2006
JWBK119-25
Char Count= 0
394 CUSUM and Backward CUSUM for Autocorrelated Observations
Let δ φ represent the error in estimating the AR(1) parameter φ. Using Figure 25.3
and given a target in-control ARL, one can see that the effect of δ φ on the appropriate
z * is less significant for φ near 0 compared to when φ is near 1. This signifies that
misspecification of φ would not result in a significantly different z * when the auto-
correlation is weak. However, for a highly positively autocorrelated process, small
misspecification of φ would result in a significantly different z * .
Since the parabolic mask that dictates the properties of the proposed CUSUM
scheme is characterized not only by z * but also by the autocovariance structure of the
assumed model, it would be interesting to see the different parabolic masks for vari-
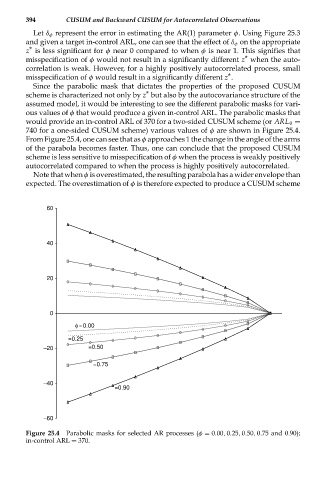
ous values of φ that would produce a given in-control ARL. The parabolic masks that
would provide an in-control ARL of 370 for a two-sided CUSUM scheme (or ARL 0 =
740 for a one-sided CUSUM scheme) various values of φ are shown in Figure 25.4.
From Figure 25.4, one can see that as φ approaches 1 the change in the angle of the arms
of the parabola becomes faster. Thus, one can conclude that the proposed CUSUM
scheme is less sensitive to misspecification of φ when the process is weakly positively
autocorrelated compared to when the process is highly positively autocorrelated.
Note that when φ is overestimated, the resulting parabola has a wider envelope than
expected. The overestimation of φ is therefore expected to produce a CUSUM scheme
60
40
20
0
φ=0.00
=0.25
−20 =0.50
=0.75
−40
=0.90
−60
Figure 25.4 Parabolic masks for selected AR processes (φ = 0.00, 0.25, 0.50, 0.75 and 0.90);
in-control ARL = 370.