
Page 98 - Six Sigma Advanced Tools for Black Belts and Master Black Belts
P. 98
OTE/SPH
OTE/SPH
Char Count= 0
2:55
JWBK119-06
August 31, 2006
References 83
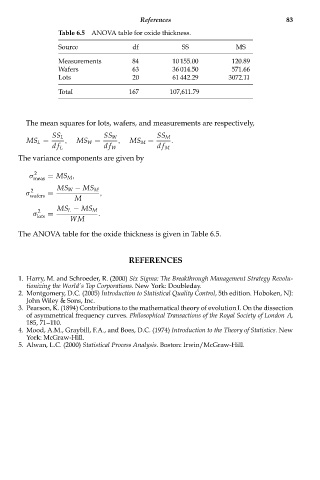
Table 6.5 ANOVA table for oxide thickness.
Source df SS MS
Measurements 84 10 155.00 120.89
Wafers 63 36 014.50 571.66
Lots 20 61 442.29 3072.11
Total 167 107,611.79
The mean squares for lots, wafers, and measurements are respectively,
SS L SS W SS M
MS L = , MS W = , MS M = .
df L df W df M
The variance components are given by
2
σ = MS M ,
meas
2
σ wafers = MS W − MS M ,
M
2 MS L − MS M
σ = .
lots
WM
The ANOVA table for the oxide thickness is given in Table 6.5.
REFERENCES
1. Harry, M. and Schroeder, R. (2000) Six Sigma: The Breakthrough Management Strategy Revolu-
tionizing the World’s Top Corporations. New York: Doubleday.
2. Montgomery, D.C. (2005) Introduction to Statistical Quality Control, 5th edition. Hoboken, NJ:
John Wiley & Sons, Inc.
3. Pearson, K. (1894) Contributions to the mathematical theory of evolution I. On the dissection
of asymmetrical frequency curves. Philosophical Transactions of the Royal Society of London A,
185, 71--110.
4. Mood, A.M., Graybill, F.A., and Boes, D.C. (1974) Introduction to the Theory of Statistics. New
York: McGraw-Hill.
5. Alwan, L.C. (2000) Statistical Process Analysis. Boston: Irwin/McGraw-Hill.