
Page 121 - Warehouse 1 to 9
P. 121
120 121
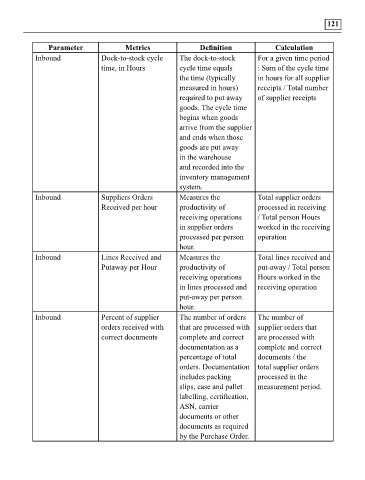
Take control of your inventory Parameter Metrics Definition Calculation
Remember that with an effective inventory management system in place, you can help reduce Inbound Dock-to-stock cycle The dock-to-stock For a given time period
costs, keep your business profitable, analyze sales patterns and predict future sales, and prepare the time, in Hours cycle time equals : Sum of the cycle time
business for the unexpected. With proper inventory management system in place, a business has a the time (typically in hours for all supplier
better chance for profitability and survival. measured in hours) receipts / Total number
required to put away of supplier receipts
It’s time to take control of your inventory management and stop losing money. Choose the right goods. The cycle time
inventory management techniques for your business, and start implementing them. begins when goods
arrive from the supplier
7.4 Measuring warehouse Performance – Key Performance Indicators ( KPI) and ends when those
As it is being said the step one to improve is to measure. We cannot improve the warehouse goods are put away
performance unless and until we measure it. in the warehouse
and recorded into the
The tool to measure warehouse performance is what we call as Key Performance Indicators (KPI). inventory management
system.
A key performance indicator (KPI) is a business metric for evaluating factors that are crucial Inbound Suppliers Orders Measures the Total supplier orders
to the success of an organization. The purpose of using KPIs is to focus attention on the tasks Received per hour productivity of processed in receiving
and processes that management has determined are most important for making progress towards receiving operations / Total person Hours
declared goals and targets.
in supplier orders worked in the receiving
KPI need to be processed per person operation
hour.
o SMART – Specific, measurable, achievable, relevant and time based Inbound Lines Received and Measures the Total lines received and
Putaway per Hour productivity of put-away / Total person
o Derived from strategy receiving operations Hours worked in the
o Clearly defined/explicit purpose in lines processed and receiving operation
put-away per person
o Mixed performance driver and outcome measures hour.
Inbound Percent of supplier The number of orders The number of
o Optimum number of measures (from 10 to 20 measures) orders received with that are processed with supplier orders that
o Construct Strategy Map (causal model—cause-and-effect relationships) correct documents complete and correct are processed with
documentation as a complete and correct
Every company can adopt its own set of KPI depending upon the requirements. Following are some percentage of total documents / the
of the possible KPI to measure warehouse performance. orders. Documentation total supplier orders
includes packing processed in the
7.5 Study on emerging trends in warehousing sector. slips, case and pallet measurement period.
Like many other industries, warehousing is being completely transformed by advances in technology labelling, certification,
and new workplace trends. ASN, carrier
And where warehousing goes, related spaces like retail, supply chain management, and transportation documents or other
will follow. The capabilities of warehouses to store, organize, track, pick and pack, and ship out documents as required
inventory determine how efficient and effective the world’s biggest businesses can be. by the Purchase Order.