
Page 48 - Bird RFP Response_Burnham Benefits
P. 48
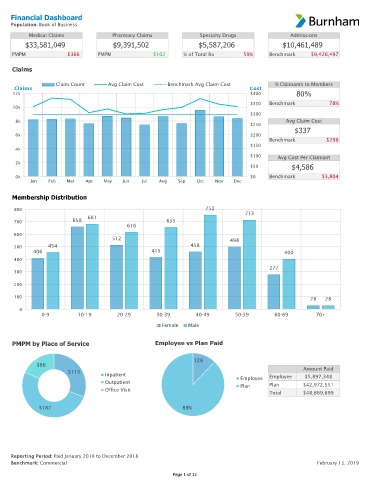
Financial Dashboard
     Population: Book of Business

           Medical Claims             Pharmacy Claims              Specialty Drugs               Admissions
         $33,581,049                  $9,391,502                   $5,587,206                  $10,461,489

     PMPM              $366      PMPM               $102      % of Total Rx       59%     Benchmark     $9,426,497

     Claims

                    Claim Count      Avg Claim Cost     Benchmark Avg Claim Cost            % Claimants to Members
      Claims                                                                        Cost
     12k                                                                            $400           80%
                                                                                    $350  Benchmark           78%
     10k
                                                                                    $300
      8k                                                                                        Avg Claim Cost
                                                                                    $250
                                                                                                   $337
      6k                                                                            $200
                                                                                          Benchmark          $298
                                                                                    $150
      4k
                                                                                    $100     Avg Cost Per Claimant
      2k
                                                                                    $50          $4,586
      0k                                                                            $0    Benchmark        $3,804
           Jan   Feb   Mar   Apr   May    Jun   Jul   Aug   Sep   Oct   Nov   Dec

     Membership Distribution

      800                                                            752
                                                                                  713
      700                658  681                       655
                                           616
      600
                                      512                                    498
      500        454                                            458
            406                                    415                                         400
      400
                                                                                          277
      300
      200

      100                                                                                               28   28
       0
               0-9         10-19        20-29        30-39        40-49        50-59        60-69         70+
                                                       Female  Male


     PMPM by Place of Service                       Employee vs Plan Paid


                                                                 12%
             $66
                        $113                                                                         Amount Paid
                                    Inpatient                                    Employee  Employee   $5,897,348
                                    Outpatient                                   Plan     Plan       $42,972,551
                                    Office Visit
                                                                                          Total      $48,869,899

              $187                                           88%


     Reporting Period: Paid January 2018 to December 2018
     Benchmark: Commercial                                                                                February 15, 2019
                                                          Page 1 of 12