
Page 51 - Bird RFP Response_Burnham Benefits
P. 51
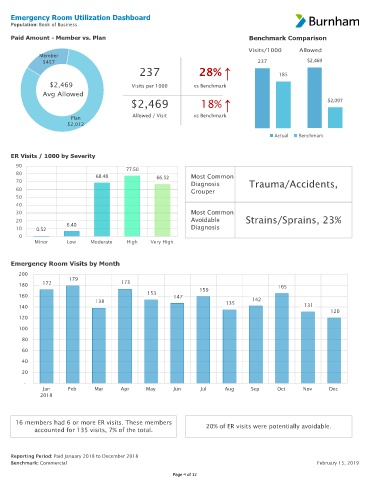
Emergency Room Utilization Dashboard
     Population: Book of Business

     Paid Amount - Member vs. Plan                                                 Benchmark Comparison

                                                                                   Visits/1000      Allowed
              Member
               $457                                                                   237              $2,469
                                               237                 28%     ↑                 185

                 $2,469                      Visits per 1000     vs Benchmark
               Avg Allowed
                                            $2,469                 18%     ↑                                 $2,097


                        Plan                 Allowed / Visit     vs Benchmark
                       $2,012

                                                                                            Actual  Benchmark


     ER Visits / 1000 by Severity
      90
                                           77.50
      80
                                 68.48               66.52      Most Common
      70                                                        Diagnosis          Trauma/Accidents,
      60                                                        Grouper
      50
      40
      30                                                        Most Common
      20                                                        Avoidable         Strains/Sprains, 23%
                       6.40
      10     0.52                                               Diagnosis
       0
            Minor      Low     Moderate    High    Very High


     Emergency Room Visits by Month
        200
                        179
        180    172                       173                                                 165
                                                                   159
                                                  153
        160                                               147
                                 138                                        135     142
        140                                                                                           131
                                                                                                              120
        120
        100
         80

         60
         40
         20
          -
               Jan      Feb     Mar      Apr     May      Jun      Jul     Aug      Sep      Oct     Nov      Dec
              2018


      16 members had 6 or more ER visits. These members              20% of ER visits were potentially avoidable.
            accounted for 135 visits, 7% of the total.


     Reporting Period: Paid January 2018 to December 2018
     Benchmark: Commercial                                                                                February 15, 2019
                                                          Page 4 of 12