
Page 49 - Bird RFP Response_Burnham Benefits
P. 49
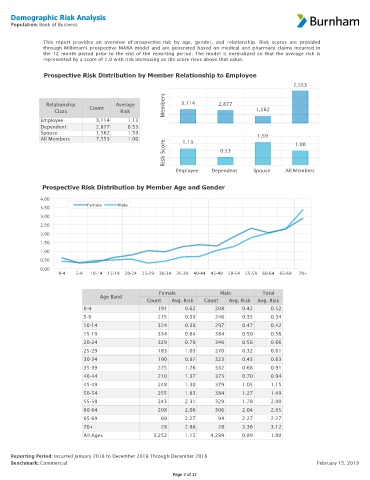
Demographic Risk Analysis
     Population: Book of Business


               This report provides an overview of prospective risk by age, gender, and relationship. Risk scores are provided
               through Milliman's prospective MARA model and are generated based on medical and pharmacy claims incurred in
               the 12 month period prior to the end of the reporting period. The model is normalized so that the average risk is
               represented by a score of 1.0 with risk increasing as the score rises above that value.

               Prospective Risk Distribution by Member Relationship to Employee
                                                                                                  7,553


                Relationship   Count   Average         Members  3,114    2,877
                   Class                 Risk                                         1,562
              Employee           3,114     1.13
              Dependent          2,877     0.53
              Spouse             1,562     1.59                                       1.59
              All Members        7,553     1.00              1.13                                  1.00
                                                       Risk Score         0.53


                                                           Employee    Dependent     Spouse    All Members

               Prospective Risk Distribution by Member Age and Gender
              4.00
                              Female    Male
              3.50
              3.00
              2.50
              2.00
              1.50
              1.00
              0.50
              0.00
                    0-4   5-9  10-14  15-19  20-24  25-29  30-34  35-39  40-44  45-49  50-54  55-59  60-64  65-69  70+


                                                      Female              Male          Total
                                  Age Band
                                                  Count   Avg. Risk  Count   Avg. Risk  Avg. Risk
                             0-4                     191      0.62      208      0.42      0.52
                             5-9                     215      0.33      246      0.35      0.34
                             10-14                   324      0.38      297      0.47      0.42
                             15-19                   334      0.64      384      0.50      0.56
                             20-24                   329      0.78      346      0.56      0.66
                             25-29                   183      1.03      270      0.32      0.61
                             30-34                   190      0.97      323      0.43      0.63
                             35-39                   225      1.26      332      0.68      0.91
                             40-44                   210      1.37      373      0.70      0.94
                             45-49                   248      1.30      379      1.05      1.15
                             50-54                   255      1.83      384      1.27      1.49
                             55-59                   243      2.31      329      1.78      2.00
                             60-64                   208      2.06      306      2.04      2.05
                             65-69                    69      2.27       94      2.27      2.27
                             70+                      28      2.88       28      3.36      3.12
                             All-Ages               3,252     1.15     4,299     0.89      1.00


     Reporting Period: Incurred January 2018 to December 2018 Through December 2018
     Benchmark: Commercial                                                                                February 15, 2019
                                                          Page 2 of 12