Page 110 - Flipbook January Board
P. 110

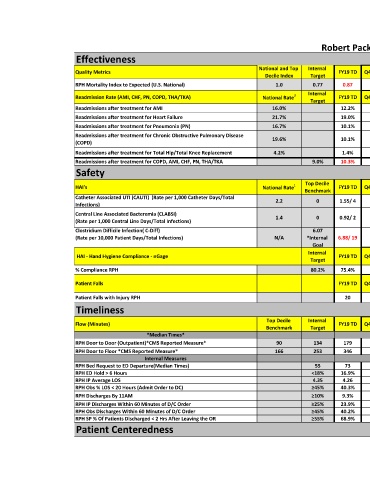
Robert Packer Hospital

                          Effectiveness
                                                                                       National and Top   Internal
                          Quality Metrics                                                                        FY19 TD  Q4 FY19  Q3 FY19  Q2 FY19  Q1 FY19  FY18  Q4 FY18  Q3 FY18  Q2 FY18  Q1 FY18  FY17  FY16    FY 15
                                                                                         Decile Index   Target
                          RPH Mortality Index to Expected (U.S. National)                   1.0          0.77     0.87                              0.88    0.85     0.92    0.76    0.83    0.91     1.02    1.16     0.90
                                                                                                       Internal
                          Readmission Rate (AMI, CHF, PN, COPD, THA/TKA)                National Rate 3          FY19 TD  Q4 FY19  Q3 FY19  Q2 FY19  Q1 FY19  FY18  Q4 FY18  Q3 FY18  Q2 FY18  Q1 FY18  FY17  FY16    FY 15
                                                                                                        Target
                          Readmissions after treatment for AMI                             16.0%                  12.2%                            10.4%    9.8%    6.5%     9.0%   12.7%    11.0%   10.4%   13.5%    15.3%
                          Readmissions after treatment for Heart Failure                   21.7%                  19.0%                            18.4%    19.8%   22.7%   18.6%   24.4%    12.3%   21.6%   22.2%    21.1%
                          Readmissions after treatment for Pneumonia (PN)                  16.7%                  10.1%                             8.6%    13.9%   9.6%    17.5%   14.5%    12.2%   16.0%   18.4%    16.4%
                          Readmissions after treatment for Chronic Obstructive Pulmonary Disease   19.6%          10.1%                             8.9%    10.8%   5.0%    14.8%    8.2%    13.8%   15.4%   20.1%    20.8%
                          (COPD)
                          Readmissions after treatment for Total Hip/Total Knee Replacement  4.2%                 1.4%                              0.6%    2.5%    2.3%     1.3%    4.3%    2.5%     4.6%    3.7%    2.6%
                          Readmissions after treatment for COPD, AMI, CHF, PN, THA/TKA                  9.0%      10.3%                             9.5%    10.8%   10.0%   11.4%   12.8%    8.9%    12.9%   14.5%    14.3%
                          Safety

                                                                                                      Top Decile
                          HAI's                                                         National Rate 1          FY19 TD  Q4 FY19  Q3 FY19  Q2 FY19  Q1 FY19  FY18  Q4 FY18  Q3 FY18  Q2 FY18  Q1 FY18  FY17  FY16    FY 15
                                                                                                      Benchmark
                          Catheter Associated UTI (CAUTI)  (Rate per 1,000 Catheter Days/Total   2.2      0      1.55/ 4                           1.55/ 4  0.79/ 9  0.37/ 1  0.34/ 1  1.51/ 4  0.96/ 3  0.51/ 7  0.63/ 9  0.43/ 6
                          Infections)
                          Central Line Associated Bacteremia (CLABSI)                       1.4           0      0.92/ 2                           0.92/ 2  0.87/ 7  1.44/ 3  0/ 0  0.94/ 2   1/ 2   0.32/ 3  0.82/ 8  0.3/ 3
                          (Rate per 1,000 Central Line Days/Total Infections)
                          Clostridium Difficile Infection( C-Diff)                                       6.07
                          (Rate per 10,000 Patient Days/Total Infections)                   N/A       *Internal   6.88/ 19                        7.86/ 13  7.04/ 44  7.1/ 11  6.18/ 10  5.91/ 9  8.99/ 14  6.84/ 43  6.74/ 44  6.99/ 47
                                                                                                        Goal
                                                                                                       Internal
                           HAI - Hand Hygiene Compliance - nGage                                                 FY19 TD  Q4 FY19  Q3 FY19  Q2 FY19  Q1 FY19  FY18  Q4 FY18  Q3 FY18  Q2 FY18  Q1 FY18  FY17  FY16    FY 15
                                                                                                        Target
                          % Compliance RPH                                                              80.2%     75.4%                            76.1%    72.9%   74.6%   72.9%   73.0%    71.1%   70.5%   70.3%    65.3%

                          Patient Falls                                                                          FY19 TD  Q4 FY19  Q3 FY19  Q2 FY19  Q1 FY19  FY18  Q4 FY18  Q3 FY18  Q2 FY18  Q1 FY18  FY17  FY16    FY 15
                          Patient Falls with Injury RPH                                                            20                               14       33       6       6       14      10       34      45      43
                          Timeliness

                                                                                         Top Decile    Internal
                          Flow (Minutes)                                                                         FY19 TD  Q4 FY19  Q3 FY19  Q2 FY19  Q1 FY19  FY18  Q4 FY18  Q3 FY18  Q2 FY18  Q1 FY18  FY17  FY16    FY 15
                                                                                         Benchmark      Target
                                                  *Median Times*
                          RPH Door to Door (Outpatient)*CMS Reported Measure*               90           134       179                              179      177     185    168.5    177      180     155     137      132
                          RPH Door to Floor *CMS Reported Measure*                          166          253       346                              346      323     339    378.5    305     301.5    274     266      310
                                                 Internal Measures
                          RPH Bed Request to ED Departure(Median Times)                                  55        73                               73       67      70      69       62      58       55      51      58
                          RPH ED Hold > 6 Hours                                                         <18%      16.9%                            16.9%    15.4%   15.3%   17.7%   14.3%    14.2%    9.8%    8.6%    11.9%
                          RPH IP Average LOS                                                             4.35     4.26                              4.26    4.24     4.12    4.38    4.23    4.24     4.41    4.36     4.43
                          RPH Obs % LOS < 20 Hours (Admit Order to DC)                                  ≥45%      40.3%                            40.3%    45.8%   42.4%   46.2%   44.3%    49.8%   38.8%   43.3%    44.7%
                          RPH Discharges By 11AM                                                        ≥10%      9.3%                              9.3%    9.7%    12.2%   10.8%    7.4%    8.6%     8.6%    8.7%    9.0%
                          RPH IP Discharges Within 60 Minutes of D/C Order                              ≥25%      23.9%                            23.9%    21.8%   22.7%   22.2%   20.0%    22.1%   23.3%   23.7%    23.2%
                          RPH Obs Discharges Within 60 Minutes of D/C Order                             ≥45%      40.2%                            40.2%    41.5%   40.7%   40.6%   42.9%    41.8%   39.3%   35.9%    35.5%
                          RPH SP % Of Patients Discharged < 2 Hrs After Leaving the OR                  ≥55%      68.9%                            68.9%    63.0%   64.7%   62.2%   58.9%    66.2%   53.0%   42.3%    41.8%
                          Patient Centeredness
   105   106   107   108   109   110   111   112   113   114   115