
Page 29 - Toolkit
P. 29
NATIONAL ARTS INDEX REPORTS
(https://www.americansforthearts.org/by-program/reports-and-data/research-studies-publications/arts-index)
From 2002-2013, the National Arts Index measured 81 indicators in nonprofit and for-profit organizations, individual artists, funding and investment, employment, attendance and personal creation. They included everything from production, presentation, exhibition, education, and heritage preservation to arts integrated in healthcare.
The “index” is a relative score that uses 2003 results acting as the Base Score of 100, the cumulative percent change up and down from that year was measured in points.
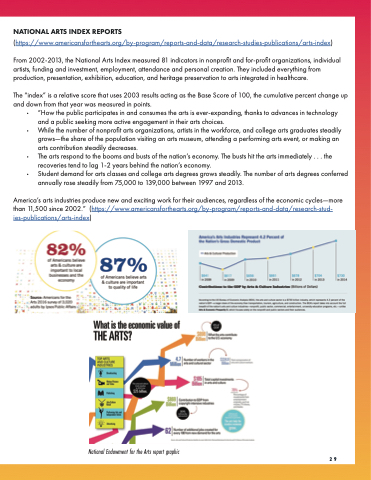
• “How the public participates in and consumes the arts is ever-expanding, thanks to advances in technology and a public seeking more active engagement in their arts choices.
America’s arts industries produce new and exciting work for their audiences, regardless of the economic cycles—more than 11,500 since 2002.” (https://www.americansforthearts.org/by-program/reports-and-data/research-stud- ies-publications/arts-index)
• While the number of nonprofit arts organizations, artists in the workforce, and college arts graduates steadily grows—the share of the population visiting an arts museum, attending a performing arts event, or making an arts contribution steadily decreases.
• The arts respond to the booms and busts of the nation’s economy. The busts hit the arts immediately . . . the recoveries tend to lag 1-2 years behind the nation’s economy.
• Student demand for arts classes and college arts degrees grows steadily. The number of arts degrees conferred annually rose steadily from 75,000 to 139,000 between 1997 and 2013.
National Endowment for the Arts report graphic
29
